Showing posts with label Phase Transition. Show all posts

Friday, July 14, 2017

If Phase Transition then target in TIME becomes 2020 followed by 2022


The Dow & the Future

QUESTION: Mr. Armstrong,
I am fascinated by what you have accomplished in this model. You mentioned in your post about the Orlando conference a sling shot and phase transition, and I am trying to comprehend what that would look like exactly. Is that to say the DJIA won't complete its advance from 2015.75 to 2018 but that the cycle inversion underlying this market and the ECM will extend the high into 2020? When will the special report on these issues be released?
Thank you for the invaluable education,
NE

ANSWER: Yes. We can see from the Global Market Watch that the current year if it closed right here would imply a temporary high. That can change since it is based upon a dynamic view assuming each day that passes were the last trading day of the year. Nevertheless, it warns that we must stay on point.
There are two separate objectives – TIME and PRICE. With regard to PRICE, our three targets given back in 2011 were 18500, 23000, and 40,000. The minimum TIME objective was 2016/2017. Our next target in TIME becomes 2020 followed by 2022. This appears to be setting up for a major vertical move. This is why we will be reviewing how to trade a vertical market.
The markets are far more precise than anyone could have ever imagined. It is unfortunate that the analytical field is plagued by people pretending to be prophets or gurus like the old snake-oil medicine salesmen of the 19th century. Nobody can forecast anything from as personal opinion perspective on a consistent basis. Sure, everyone can make a single forecasting call based upon a gut feeling. But they cannot accomplish that on any consistent basis. This is all about a journey into a world of hidden order – the chaos theory. It is not being a prophet, guru or physic. Such titles reduce the analyst to a snake-oil salesman

Sunday, August 7, 2016

Europe-2027, Slingshot v Phase Transition

Slingshot v Phase Transition

Posted Aug 7, 2016 by Martin Armstrong

You’ve just mentioned there remains a chance for gold to perform a slingshot move downward and then up in January. Does it still appear the Dow will slingshot (make a new low) also even though it has recently broken to new highs?
S

ANSWER: We achieved the SLINGSHOT in the S&P and the NADAQ and I have previously warned that we did not need to do that in the DOW. Still, there are SLINGSHOT type of moves that are fractal, so they take place on a daily, weekly, and monthly level. We do not need to accomplish that in the stock market. However, since this is 2016 which is 7 years up from the low, there runs the risk of a temporary high and what might appear to be a correction in 2017. However, this need not be a SLINGSHOT insofar an penetrating the 2016 low. The majority are bearish already. Therefore, we can coil and build a based for a PHASE TRANSITION. However, keep in mind we are running out of time. This in itself is rather serious because we may have no time before the explosion unfolds and these four political elections from HELL are illustrating there is a problem with confidence in government.
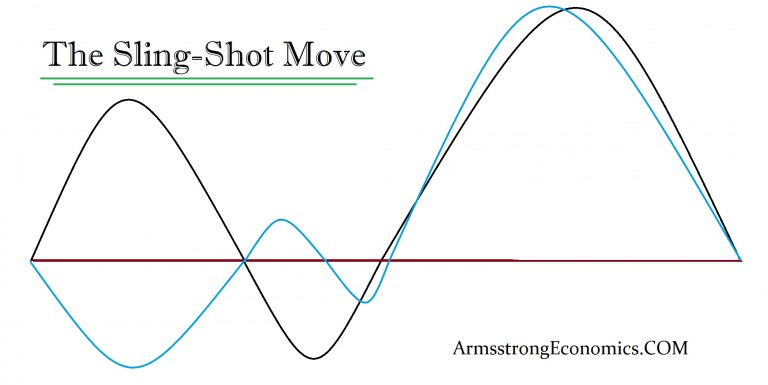
The difference between a SLINGSHOT and a PHASE TRANSITION is rather significant.
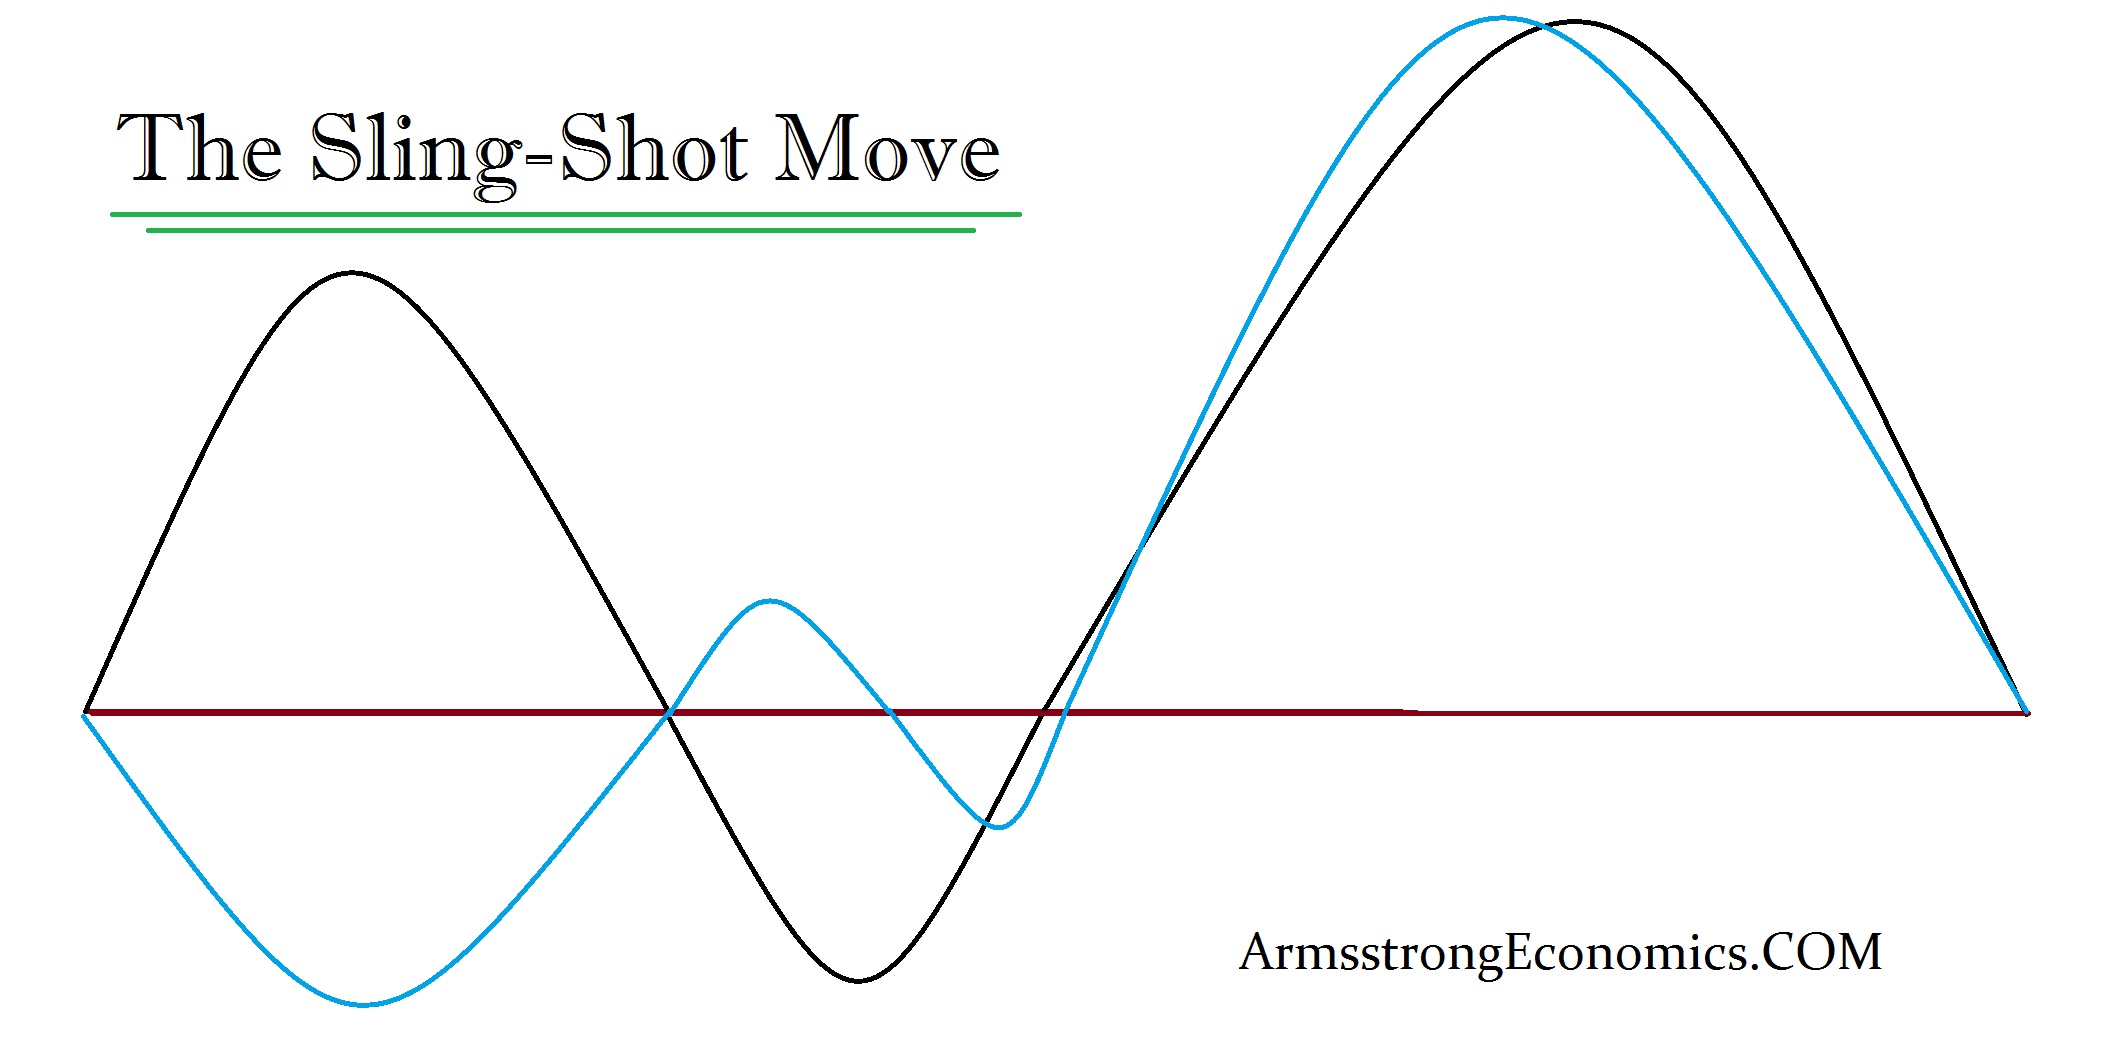
Sling-Shot Move
The SLINGSHOT typically fakes everyone out by moving first in the FALSE direction and then it swings back a moves to new record highs or lows. The fuel to create such a move is trapping people on the wrong side and then they fight it. For example, when everyone just sits with positions and praying for new highs, they lack the buying power to keep the trend moving and everyone wants to sell the new high to make a profit or break-even. That typically results in just a water-torture test of slowing eating away at those long positions.
19 Year Decline

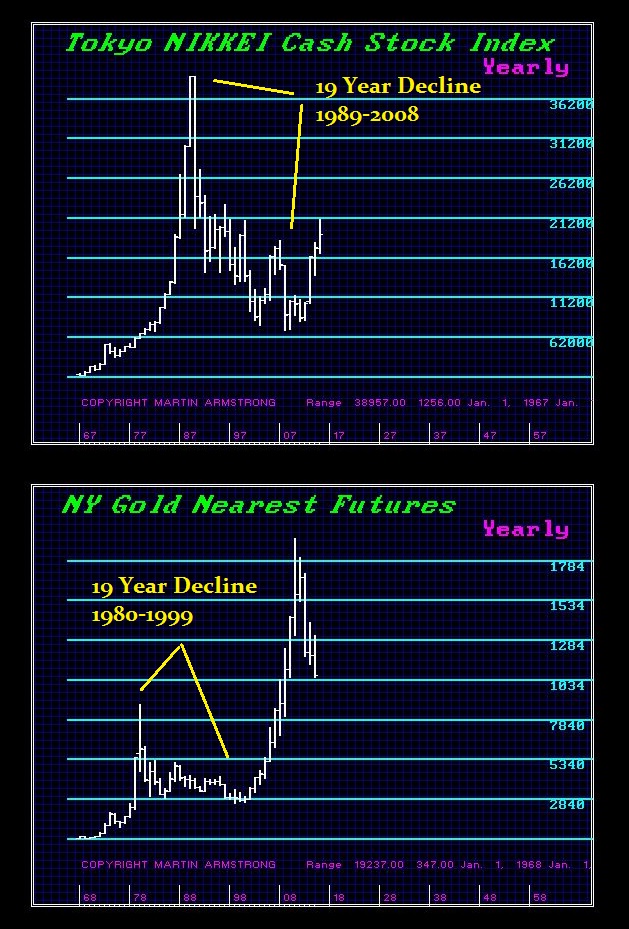
This type of pattern where bulls refuse to admit a mistake causes a 19 year Bear Market which is classic. This was the primary reason why the NIKKEI could not recover in Japan. Everyone was long just waiting for the rally so they could sell just to break even. Real Estate agents I know in New Jersey say if the price of the average home ever got back close to 2007 levels, half the State would be up for sale. This is simply how ALL markets trade be it gold, stocks of real estate. This appears on a worldwide basis regardless of culture or the century. This is simply how human nature responds. People will cling to their mistakes for a very long-time before they throw in the towel.
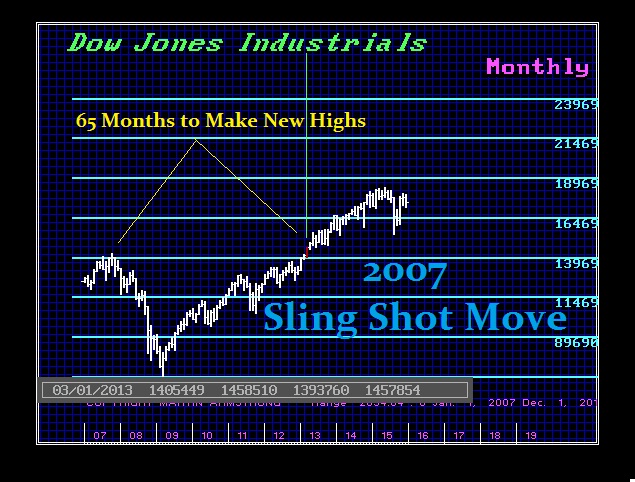

2007 Sling Shot

slingshotSo yes. Unless gold can close above 1362 on a monthly basis, the risk of a SLINGSHOT move still exists. Of course the gold bugs will say never. They are no different than the Japanese who refused to believe the NIKKEI would make lower lows. But this is the actual mechanism that create the breakout rallies. The greater the SLINGSHOT on the downside, the steeper the move on the upside.
This is simple physics. The more you pull back on the projectile, the further it will travel. Why has the US share market continued to rally yet the VAST MAJORITY keep calling for a crash? This is precisely how a SLINGSHOT operates. The fuel to the upside is created by that false move which can last for several years. They are still fighting the market and keep trying to sell the high. They are constantly forced to buy it back.
The most bullish position for gold would not be a rally, but a SLINGSHOT to the downside FIRST. That will convince everyone it’s a bear market and then they will fight the rally exactly as they have done in the US share market. Then you will have the confirmation that it will move higher.
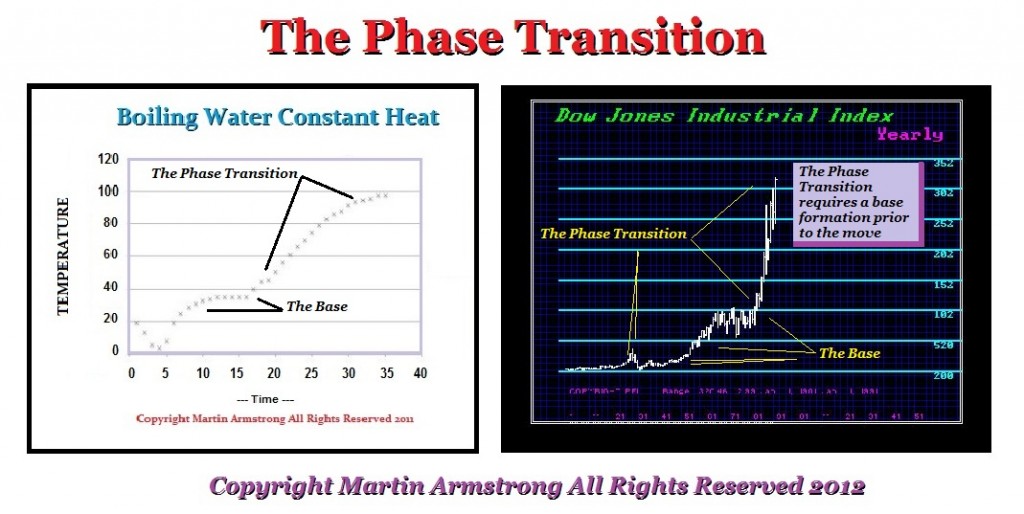
PhaseTransition
Slinky


A Phase Transition is different. This is an explosive rally which emerges from a base which is akin to a spring. The tighter the spring is compressed, the greater the move to a new level. This is something that is mathematically calculated with the degree of energy that has been compressed. When released, it simply explodes. This is often the type of move which sucks everyone in and they then expect this to be the norm.
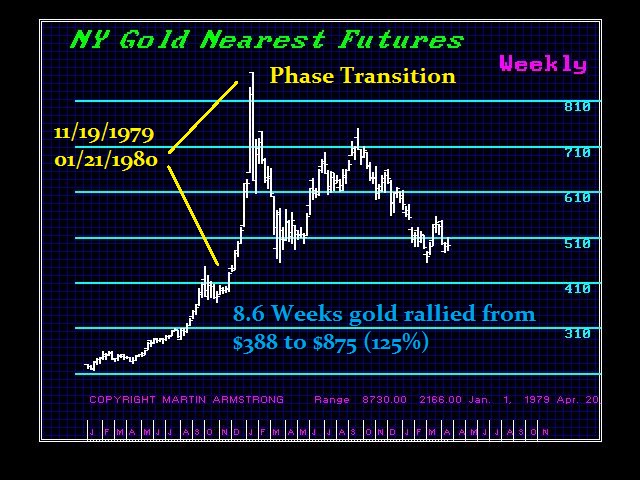
Phase Transition GC1979-1980-W

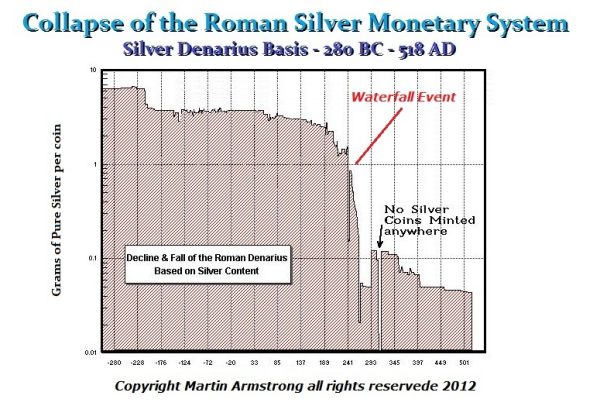
Roman decline silver content monetary system - Armstrong Waterfall effectPhase Transitions often alter the thinking of people so dramatically that they lose all reason. The Phase Transition in gold creating the 1980 high on January 21st, 1980 at $875, unfolded in just 8.6 weeks. That simple brief period set in motion decades of people calling for the same thing over and over again. That brief Phase Transition convinced scores of people this was permanent and gold would now soar to multiple of $1,000.
The collapse of Rome was also just 8.6 years. It is amazing how this frequency appears throughout history and has such a profound change to the upside or downside. We see the complete implosion of the Roman economy where the coinage was mostly silver to less than 2%. People hoarded money so to pay the bills, the only recourse was debasement. Taxes collapsed as did the economy just after the Emperor Valerian I was captured in 260AD. By 268AD, his son Gallienus is assassinated and the coinage no longer resembles what existed pre-260AD.
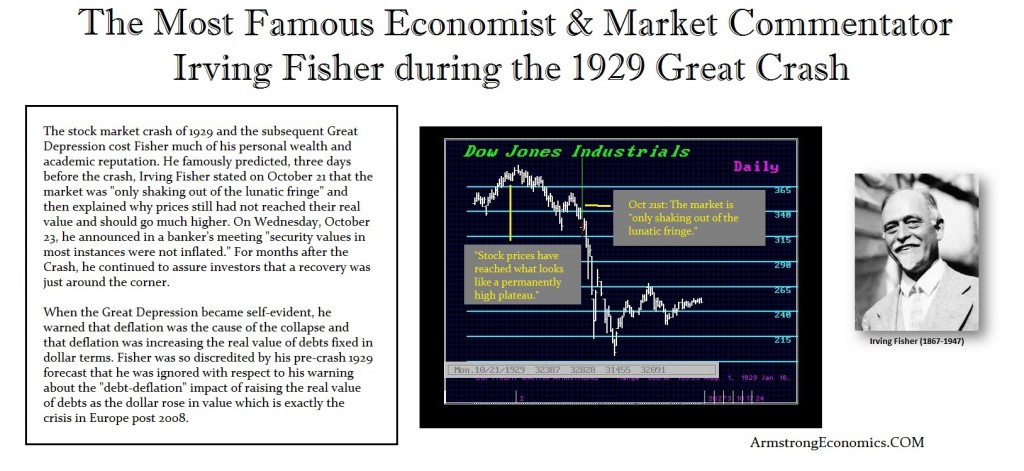
Irving Fisher Comments 1929DJ-1927-29 Phase Transition


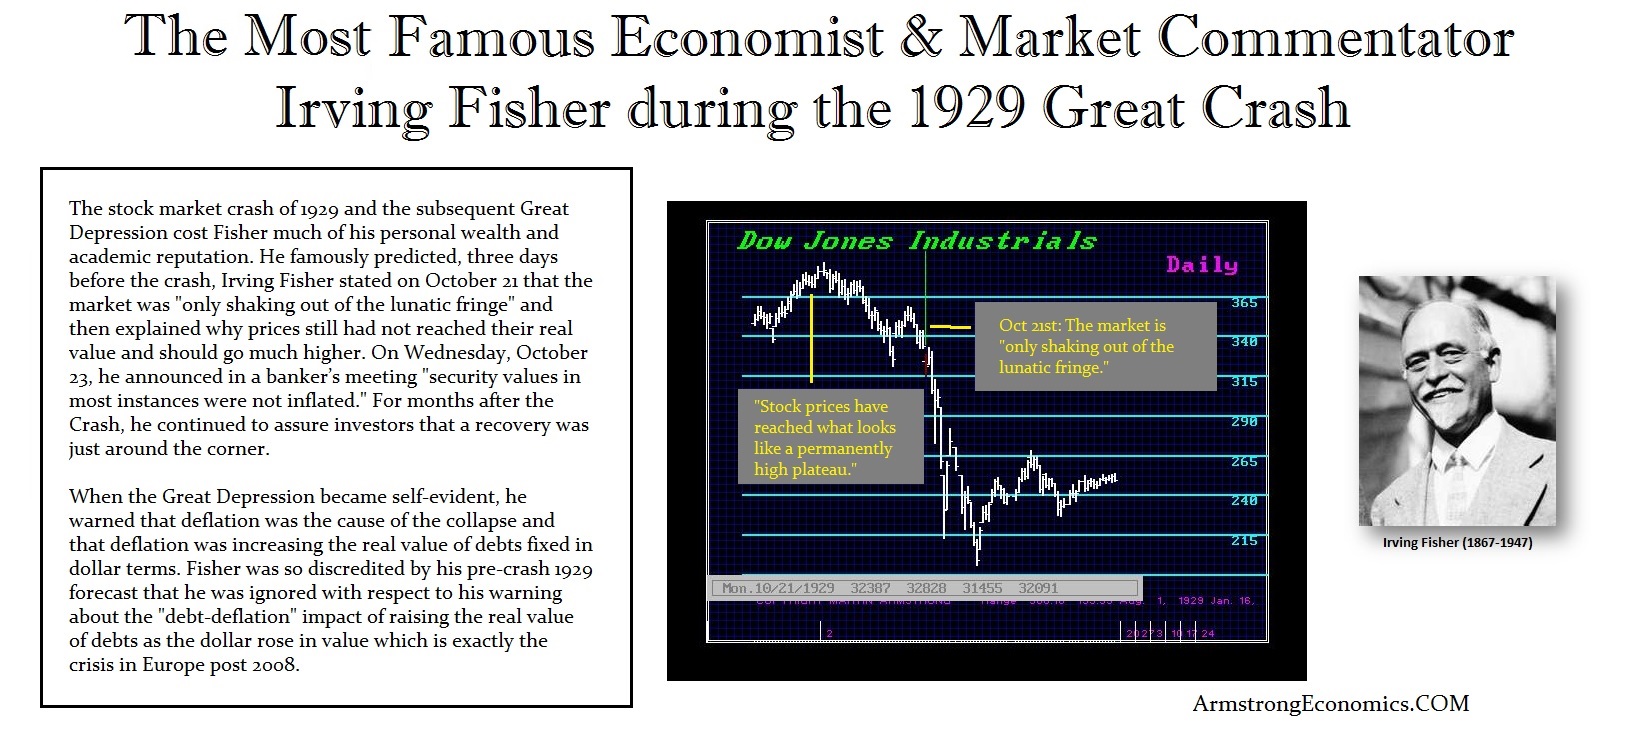
The Phase Transition in the Dow going into 1929 ruined the reputation of the leading economist and market commentator Irving Fisher (1867-1947). Three days before the high he pronounced that the “stock prices have reached what looks like a permanently high plateau.” The Phase Transition of the US share Market into 1929 on a monthly level was 37.3 months (8.615 * 4.3). Likewise, on the weekly level, the overall final Phase Transition was also 13 weeks from 300.10 to 386.10. However, on the daily level, the final rally was a brief SLINGSHOT and from that low it was a 17.2 day rally (2 * 8.6). Therefore, it was within that final 17.2 days that caused Fisher to proclaim a new permanent high level. This is the classic Phase Transition. Then, even as the market began to crash, precisely on the 34th day of that decline a temporary low formed which was 4 cycles of 8.6 days. He then pronounced that the market was “only shaking out of the lunatic fringe.” He coined a saying that has long since remained.
Thereafter, Fisher came to understand the mechanism that a rising currency increased the “real value” of debt and people could not then service that debt resulting in a cascade of defaults. Nevertheless, the Phase Transition has a historical impact upon the thinking process of people. In Japan, it took 19 years to reverse that decline as it did in gold. In the case of the US stock market, it took 25 years to exceed that 1929 high. It was 19 years until 1948 which was the final fake low before the breakout rally truly began which was also 19 years. In the case of Europe, it appears it may also take until 2027 before any real life comes back into the economy once again

Wednesday, May 13, 2015

As long as the share markets DO NOT make highs with the ECM, then it still appears we can have that Phase Transition into 2017.


Yields Are Collapsing on Short-End
           

BUNDFG-D 5-13-2015


The amount of cash rushing around on the short-end is stunning. Yields are collapsing into negative territory and this is the same flight to quality we began to see at the peak in the crisis back in 2009. The big money is selling the 10 year or greater paper and everyone is rushing into the short-term. There is not enough paper around to satisfy the demands. Capital is unwilling to hold long-term even the 10 year maturities of governments including Germany. This is illustrating the crisis that is unfolding and there is a collapse in liquidity.


As long as the share markets DO NOT make highs with the ECM, then it still appears we can have that Phase Transition into 2017. It appears we are headed into that false move that requires the share markets to decline which then send cash running into government debt. What is unfolding right now is the severe decline in confidence in government is causing the big capital to sell the long-end and move to the very short-end. So we should continue to see this trend and the rates should continue to move negative in that paper.


BUNDFOR-W 5-13-2015


Since we elected two Weekly Bearish Reversals at 15620 and 15630, the correction was confirmed. However, the next reversal was at 10522 and a Monthly Bearish lies at 15065. This is the critical area to watch for a weekly closing below this level will warn that the highs are clearly in place and we will see long-term rate start their rise. Smart capital sees the crisis. Look for the development here going into the last week of May. We should get a bounce thereafter, but government debt will decline after 2015.75 on a worldwide scale.
The share markets hopefully create the false move and that should send more capital rushing into government paper. There is not enough short-term paper around so we should then see capital forced to start moving up the maturity duration just to park money as share markets correct. Keep an eye on the Global Market Watch. That should help to pick the highs and lows specifically in different instruments.

Wednesday, November 19, 2014

18K on the Dow by mid-Dec. Dow at 23K-26K by Sept '15. Exceeding that area, Dow up to 40k-43k


The Dow – Starting a Cycle Inversion?

DJIND-D 11-19-2014
 The golden rule of trading is just this -
What goes sideways when it should move up or down, moves in the opposite direction even stronger.
Where we achieved the temp low in gold on the target week of 11/03, the Dow has moved sideways and is crawling along resistance. Given the G20 position of walking away from bank bailouts, leaving the Cyprus bail-in solution still open, smart money is starting to move off the grid in a very big way. We are tracking capital flows very closely right now. It appears this target on the Cycle of War has an impact.
Of course, then we have the really brain-dead behavior of world leaders acting as if this is high school – Don’t talk to Putin or shake his hand because he didn’t do what I told him to do! With such immature behavior on the part of this Gang of 20 pretending to be world leaders, I have never seen such stupidity. I was just asked are there any world leaders with whom I could have a serious discussion? My reply – no! I have yet to meet anyone since Maggie Thatcher who was smart enough to talk about real strategy without a teleprompter or aids explaining in an ear piece. This seems to be what the bureaucracy wants. While the cat is suffering from dementia, the mice can play.
DJFOR-W 11-19-2014
The Dow is crawling along daily resistance. Timing should have worked normally. A high in November should have been followed by a drop back into the week of 12/15. What will not go down, only goes up. If we close higher this week and see new highs next week, it looks like we are headed into the low 18,000 level on the Dow by mid December.
DJIND-W 11-19-2014
 We have the seasonal turning point of January. The key resistance is at the 18133 to 18200 level as the weeks move forward. This has been the top of the Primary Breakout Channel from the ECM turn back in 2011. This channel has performed perfectly containing everything up and down. If we start to break out above this channel and close above it on a weekly basis, this is the warning that we may see the Dow at the 23000-26000 by next September. Exceeding that area will warn of a possible real blast in a Phase Transition that can take the Dow up to 40,000-43,000.
Fundamentally, who knows. There are too many variables to nail it down to just even a few reasons. We have the Sovereign Debt Crisis, the potential for international war, and major civil unrest. YET this is just the beginning. Add in pensions, bank failures, G20, and a host of other reasons, and some people will respond to one type of event while others will select a different fundamental. This is what is wrong with those who try to predict the trend with fundamentals. They reduce it to one reason and it never can be just one. We are not robots. Everyone will respond appropriately based upon their view.
So pay attention. What will not go down when the cycles shift, inverts and rises even further. There is always a reason for what markets do – you just have to pay very close attention. This is why I have been warning a cycle inversion is coming. We may be in that process now starting from November 19th/20th.

Tuesday, October 14, 2014

We are looking at a rally into 2017-2018 with the Dow reaching the 25,000-28,000 level. Gold rally with the ECM downturn.


So When Will We Know?


UP-DOWN
All year we have been warning that a Phase Transition is coming, but when could not be ascertained until after September 2014. At some point everything must flip. Why?Because this is a Sovereign Debt Crisis not the normal plain vanilla decline. This is why retail participation is at historic lows and liquidity is at historic lows. We have a Phase Transition coming largely because when the majority of people begin to figure out the problem is government at all levels, then capital will panic and flee to the private sector.
Assignat_de_5_livres_(de_la_République)
 Such panic shift from Public to Private vary in degree historically. This is actually what takes place in a hyperinflation where people move to private assets and dump the currency. But that is only one version for revolutionary type affairs following the overthrow of a government. This was the Communist Revolution in Germany during 1918, the French Revolution, and the American Revolution. Each experienced varying degrees of hyperinflation with either a default on the previous government debts or the currency. Today, we have governments with outstanding debt that did not exist in Germany or France since the new government defaulted on the previous government debt leaving only currency. The American colonies also assumed no portion of the English national debt.
This shift from Public to Private assets is WHY we could see the US share market extend into 2017-2018. The traditional business cycle decline you have the flight to quality with capital fleeing back to government bonds selling stocks. But what happens when it is government bonds that crash and burn? This is when the capital flows reverse and will shift back into private assets. For this immediate correction, cash is fleeing back to government bonds. This may be the last rally in bonds setting the stage for the extension.
ECM-Wave-2011-2020
So far we have the peak with the ECM in September right on target. In theory, if the market were to invert all the way into a low for 2015.75 next year, then we would be looking at a full blown cycle inversion with stocks moving up with the drop in the ECM. This would be a tremendous rally, but it would come at the cost of a real serious collapse in the confidence of government. This may be what we are facing. Instead of a Phase Transition that doubles the Dow Jones from the 2009 low of 6,440 (12,000), which we have already achieved, we are looking at a rally into 2017-2018 with the Dow reaching the 25,000-28,000 level. That would be the minimum target objective. To match the rally between 1921 and 1929, the Dow would need to reach 39,482. We have been looking at a 4.3 rally (430%) which is half the 8.6 year frequency.
ECM2011
This inversion pattern we have begun to see in the metals. Gold rallied in a sharp advance ONLY when the ECM turned down 2007 and it peaked in 2011. Gold appears to have made that transition and it should rally with the downturn in the ECM.
Completing this inversion process in stocks now will be interesting indeed. However, it also means we are about to face some very, very, very wild times ahead. Yes there will be money to be made – but we also have to be worried about the results.
We must pay close attention here. If this week closes higher in the Dow above 16544, then we may see a reaction into early November during the first week. However, we have another key turning point shaping up for the week of November 17 targeting the days of the 19th/20th.
We will let you know when is the best time to go back in. So far the September high with the ECM to be followed by a November low appears on target.