Did the Economic Confidence Model Pick the Trump Tax Reform?
Posted Dec 20, 2017 by Martin Armstrong
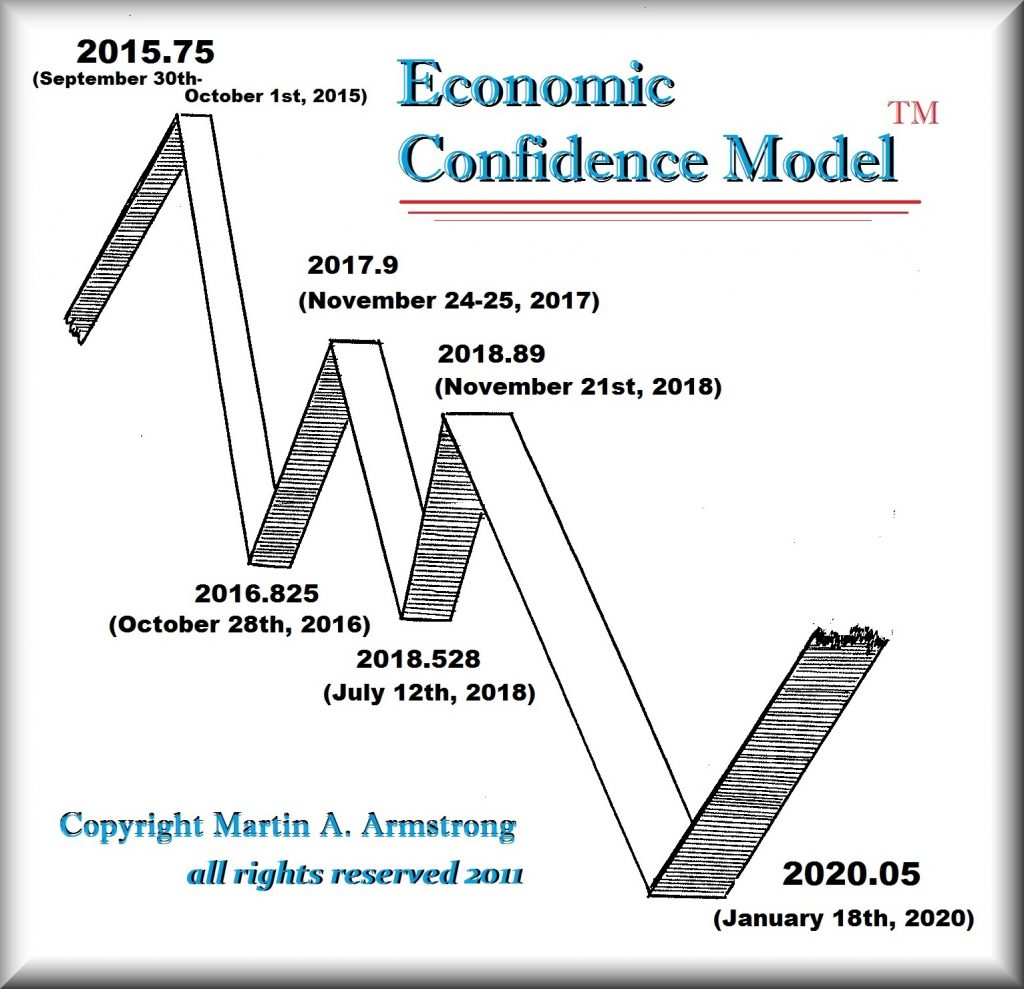
It is very interesting how the 2017.9 (Nov 24/25) turning point on the Economic Confidence Modelhas marked a most interesting political event. The House passed their version of the Trump Tax Reform on Thursday, November 16th, 2017 just 8 days before the ECM target. Then on November 29th, 2017, the Senate passed a procedural vote on the Trump Tax Reform bill that allowed debate to begin on the measure with a final vote which came on Saturday, December 2nd, 2017, which was 8 days after the ECM turning point making it the dead center between the two votes.
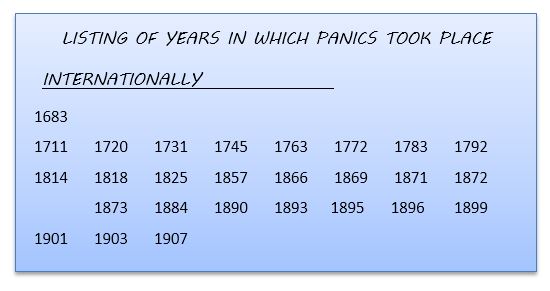
People have asked me constantly how in the world did I ever discover such a model that has worked amazingly? I have written before how I discovered this list of panics while doing research in the Princeton University Firestone Library. The time span was 224 years and the number of events was 26. I sought to simply see what the average was and that came out to be 8.61538461538. I had absolutely no idea how significant that number would prove to be.
As I observed this cycle, I was blown away by how accurate it had been. It was even accurate to the very day. That to me, seemed very unlikely and strange. AT first I believed it was just a stroke of luck – a coincidence. But the more I observed the repetition to the day was taking place around the globle. The number of days in an 8.6-year cycle was 3,141 which was Pi. That, of course, was the perfect cycle.
I will be republishing my work on this astonishing discovery. For now, the amazing regularity of this model is simply there for all of us to observe and wonder at the regularity of the world around us.


No comments:
Post a Comment