Posted Jul 10, 2018 by Martin Armstrong
QUESTION: Martin,
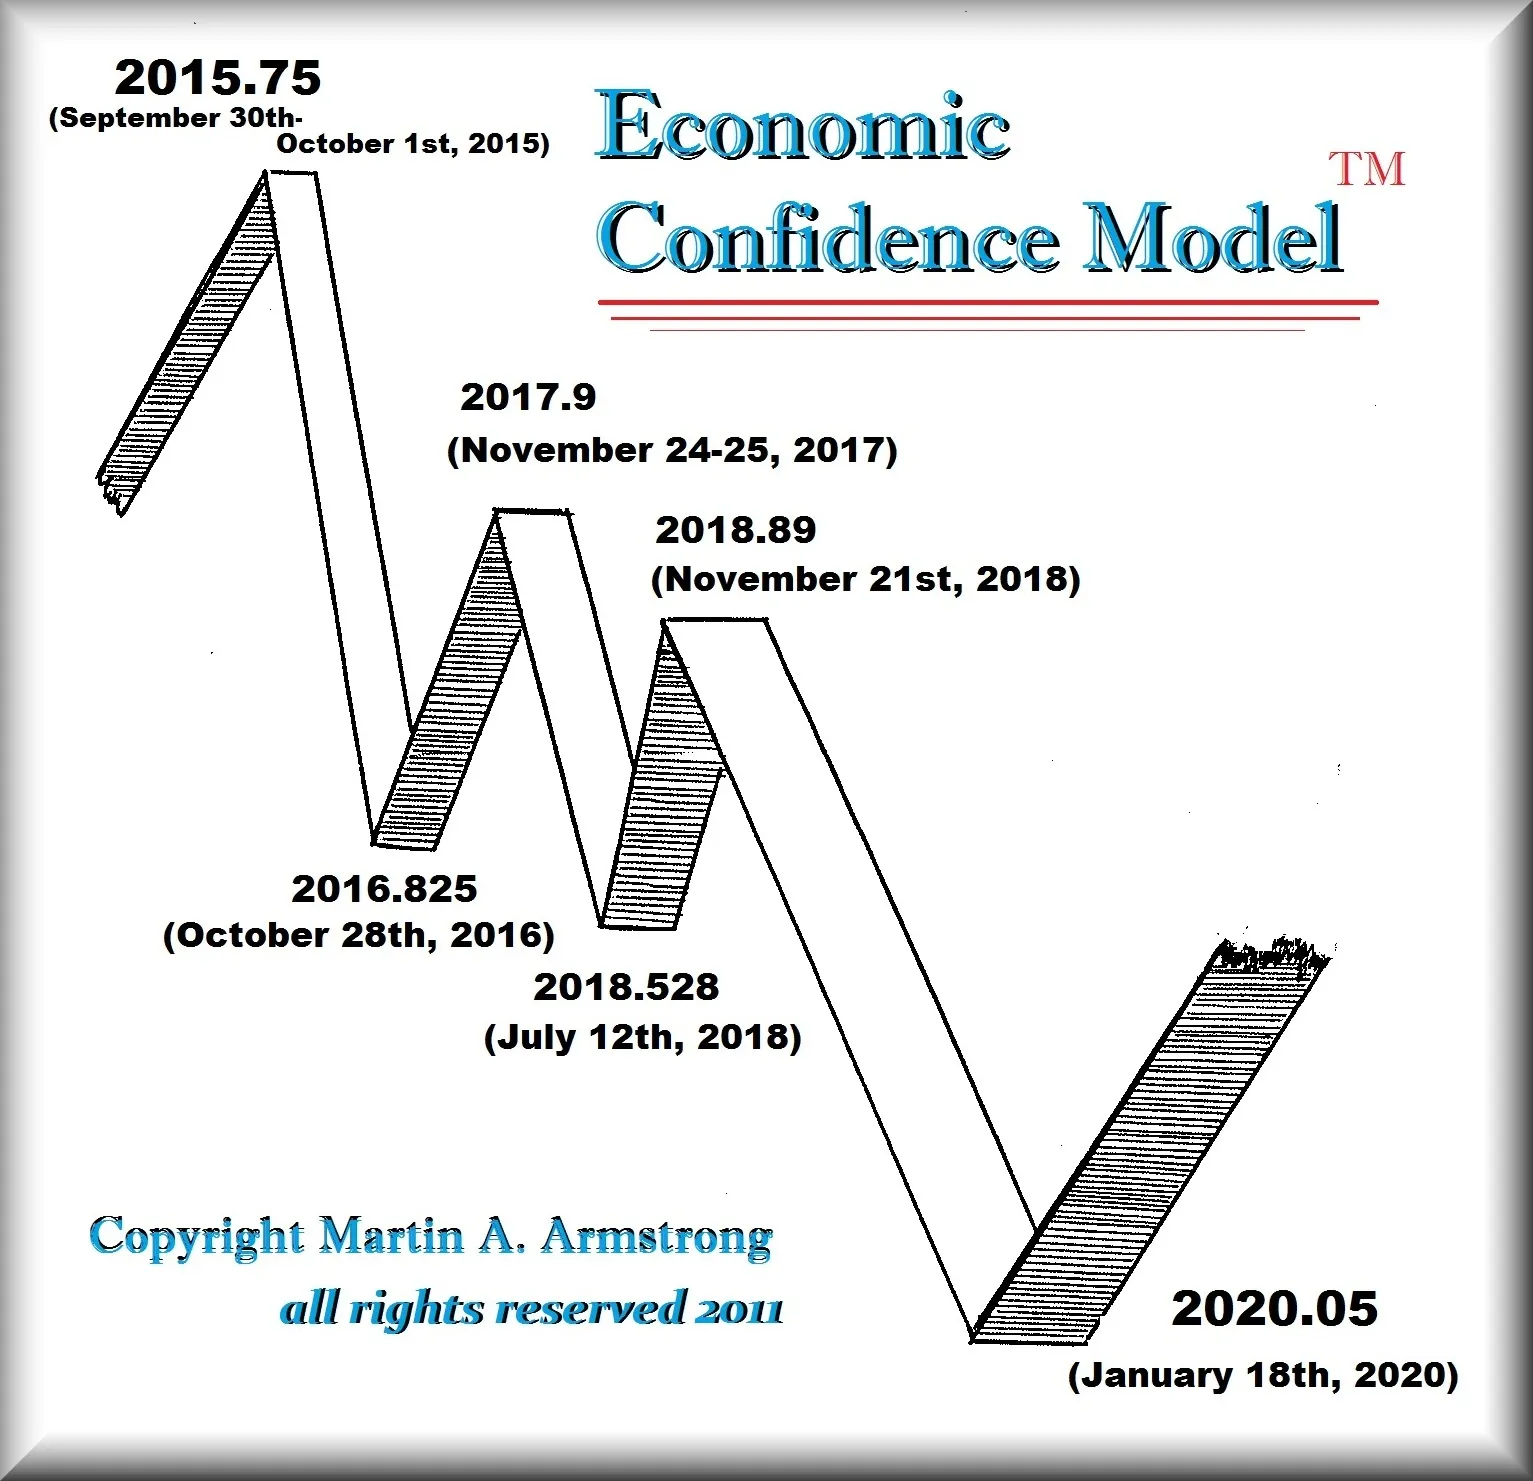
I know that the basic ECM cycle’s 4.3 year decline subdivides into a 1.075 year decline, 1.075 year rise, and 2.15 year decline. However, if I remember correctly, the 2.15 year decline also includes the Pi cycle turn 3.14 years from the top.
If I remember correctly for this ECM cycle, the 2.15 year decline began 2017.9, should turn up about July 12, top with the Pi cycle 2018.89, and finally bottom 2020.05.
I have always wondered, (1) what is the basis of determining this turn up into the Pi cycle, and (2) is this turn up ever significant, or simply a setup for the major event, the November 22 (2018.89) Pi cycle?
Of course, please feel free to correct any of errors in my interpretation of your ECM.
Thanks,
-DB
-DB
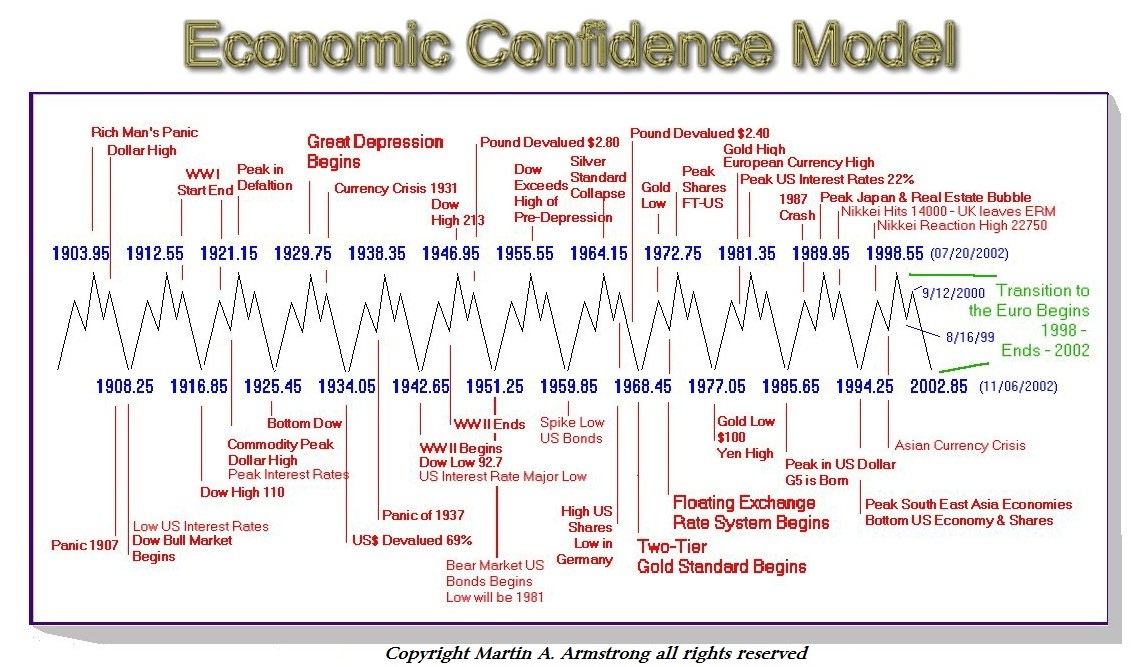
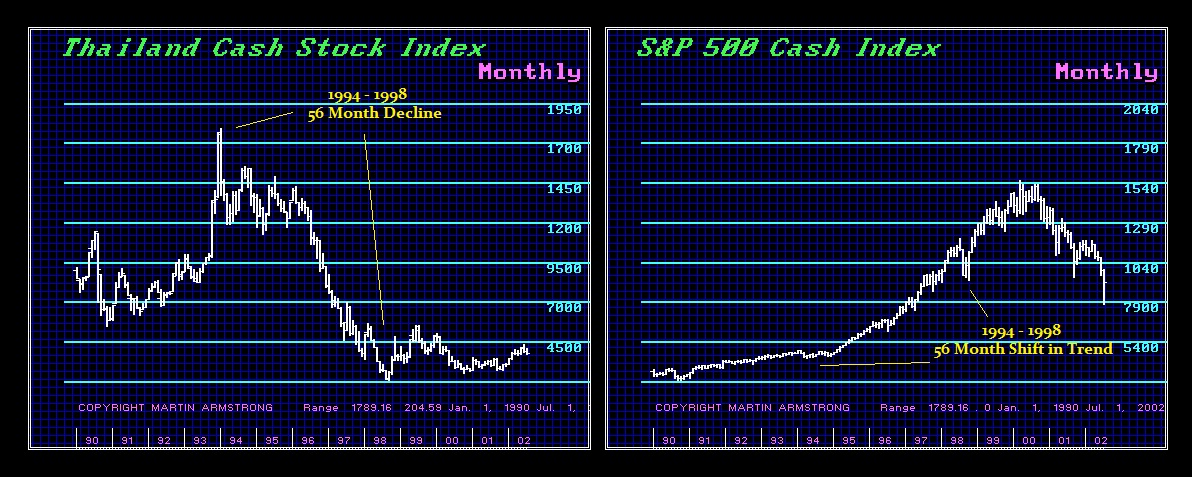
 ANSWER: Keep in mind that this is the global business cycle and not based an individual country. Therefore, we have peaks in one country and bottoms in another on the same turning point. For example, the 1994.25 turning point was the peak in the economies of Southeast Asia. Even when things do not line up precisely to the day with the ECM, the trend changes regardless. The turning point was March 1994 and here we turned in February. The correction at the end of 1998 was the Long-Term Capital Management collapse that was instigated by the loss in emerging markets, namely Russian bonds. I warned them that emerging markets peaked in 1994 and the capital flows shifted. They would not listen, invested in Russia because they assumed they bought the IMF, and when it all blew up they blamed me.
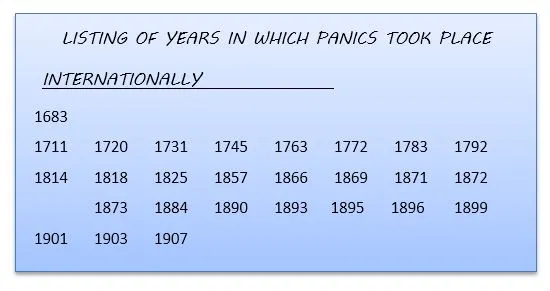
I have published this list of panics that I had discovered while doing research in the Firestone Library at Princeton University. Note that the first one listed was 1683, which was the Turkish invasion to conquer Veinna (the capital of the Holy Roman Empire at that time). It ended Austria as a financial center. Note 1720, which was the South Sea Bubble in Britain and the Mississippi Bubble in France. The list that led me to the discovery of the Economic Confidence Model was international. Therefore, the business cycle I discovered was INTERNATIONAL, and by that very nature it means that when one nation peaks, another bottoms.
No comments:
Post a Comment