Tuesday, January 19, 2016

Oil - support $25, buy only after $42

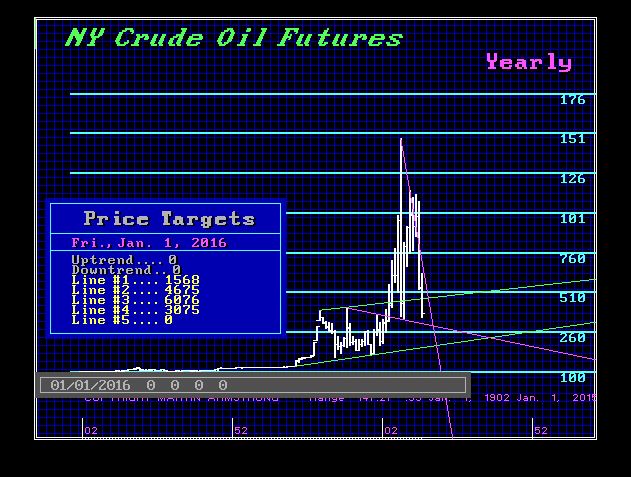
Crude – What Lies Beneath $30 & Where Will Resistance Stand Here After

Crude-W 1-18-2016

Right now, the fear has been that Iran will start dumping oil now that the sanctions have been lifted. Thus, crude has been falling out of bed in a nightmare scenario. The fact that Crude was below $35 and then rallied to close above it for the 2015 year-end closing was a warning that the long-term may not be as bearish as it appears at first glance. Crude still elected a year-end sell signal at $41. So that meant lower lows. But our other two numbers were $35 and $25. Breaking $30 certainly focuses our attention on the $25 level as support on a system basis. Technically, the $25 area is also showing up as support during January.
Crude-FOR-M 1-1-2016
Cyclically, this collapse in price has been on target since our timing projections have been January, March, and June here in early 2016. We have warned that 2016 was the target for at least the intraday low.
Crude-Y 1-18-2016
Crude-FOR-Y 1-1-2016
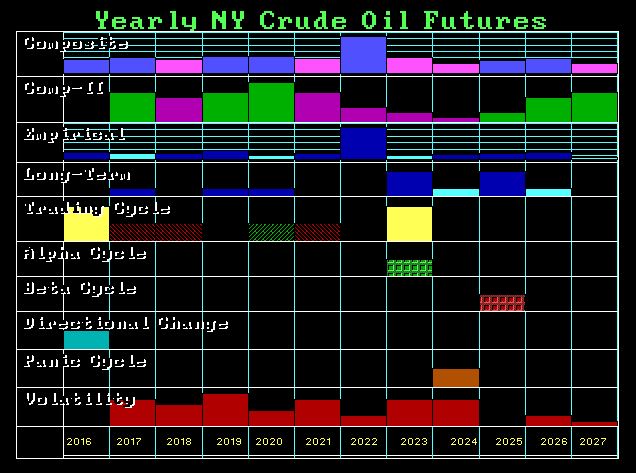
When we start to look at what the computer is projecting in time, indeed 2016 is a Directional Change. It appears choppy until about 2018. From there out into 2022 to 2023/2024, which will be the next top in the Economic Confidence Model, we see a sharp rise in volatility. This is lining up with two primary factors – WAR and a MONETARY CRISIS.
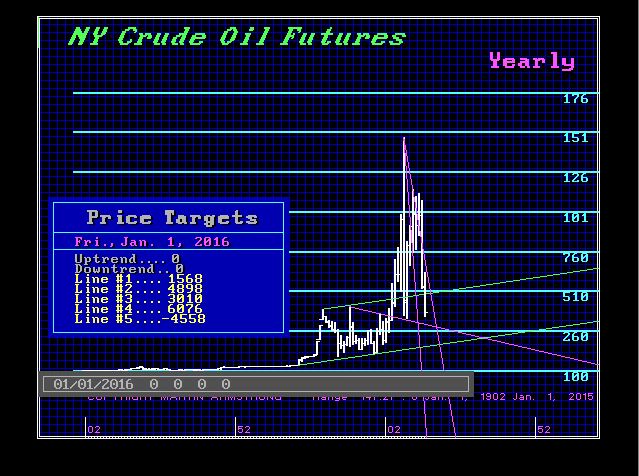
So for now, we should focus on the $24-$25 area as the next psychological support zone. Our two key areas of target support for 2016 are $25 and $16. Looking forward, we employed our WHAT IF models to try to forecast where the Yearly Bullish Reversal (buy signal) will be generated from a low at either position in 2016. Interesting enough, in both scenarios, we end up with $40-$41.50. This will clearly become the major resistance moving forward. It does not appear that crude will ever make new intraday highs. It must fight against a dollar rally which appears to be still on the horizon and a shift to electric cars.

Thursday, January 14, 2016

Dow - extension beyond 2017 if monthly closing below 16013


DOW & the Decline


DJIND-D 1-6-2016
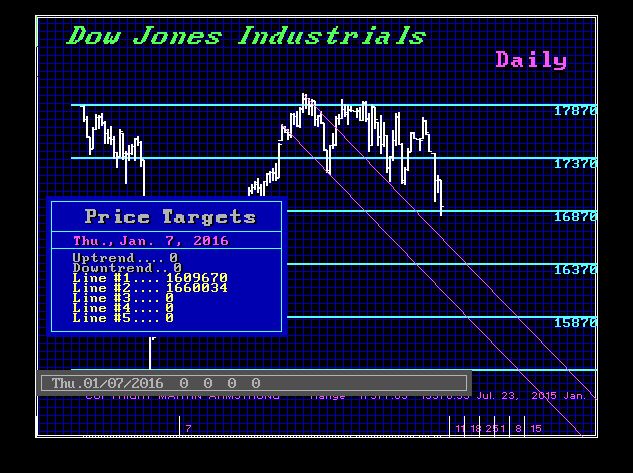
The U.S. share market has fallen following the problems in China. We elected the Daily Bearish Reversal at the 16933 level and this warned of a test of the next important support zone. A daily closing below 15980 will warn that we may in fact penetrate last year’s low and pull off a slingshot move.  We previously warned: “We have initial support forming at the 16886 level and a weekly closing below that will confirm a continued decline. Our daily models warn of important support starting at 16930.”
Our Panic Cycles began to turn up this week moving into next week. If we penetrate last year’s low of 15370, then we may see a drop to retest the major support area in the 12875-13100 area. We should break the market FIRST and this appears to be setting up for the extension beyond 2017. A monthly closing below 16013 will signal that the market should crack and then we will be set up for a really wild rise.

Wednesday, January 13, 2016

Dow & the Trend For Now


DJIND-M 1-8-2016
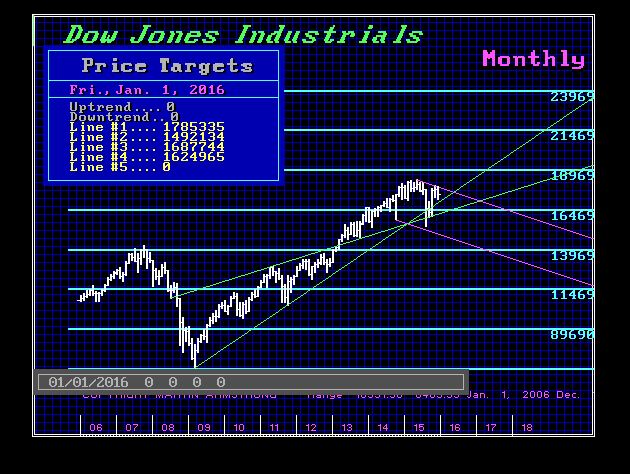
Back on November 13, 2015, we reported: “The Dow is pulling back on schedule. We do not see a breakout to the upside. This should tread water for a bit, waiting for everything to align. A closing today below 17785 will signal that this is not ready to breakout and a retest of support is likely. Key support lies down at 16500.” We have breached that support level now, which brings our focus to the 15900-16100 area.
DJFOR-W 11-13-2015
Here is the Weekly Array we published back then. Note that this past week of January 4 showed a Panic Cycle even back in November 2015. Next week is highlighted as the turning point, and we have a Directional Change coming into play next week as well.
The initial support at 16500 has given way and we Elected a Weekly Bearish Reversal today. That report was written just after the November high was made. We elected the first Weekly Bearish at that time, which signalled a test of the next would unfold. Now we are focusing on the monthly support, and if that gives way then we will likely see the slingshot move unfold.
slingshot differs from a Phase Transition whereas the former you go down FIRST and then swing around and make new highs. This was accomplished from the 2007 top, the 1998 high, as well as in 1987.Phase Transition is simply an explosion to the upside, which typically lasts, at most, two years or about 13 months.
Keep in mind that the MAJORITY must be wrong — ALWAYS. That is the very fuel that drives the markets. The best we have are the Reversals and the Arrays. Opinion fills the air, but opinion is not a forecast. The market will tell us what we face now. Next week is likely to see a lower low for it is the timing target and the Directional Change.
DJIND-Y GMW 1-8-2016
The November high implies a decline for the First Quarter. Everything will hinge now on the Monthly Bearish Reversals. The Global Market Watch finished the year also warning that we had a temporary high. The year-end closing was LOWER and it even closed below the OPEN of 2015. These were warning signs that we would retest support BEFORE making any new highs.

Fundamentals, Reserves, Balance sheets

Do the Reserves of a Nation Matter Anymore?

China-Yuan-Currency
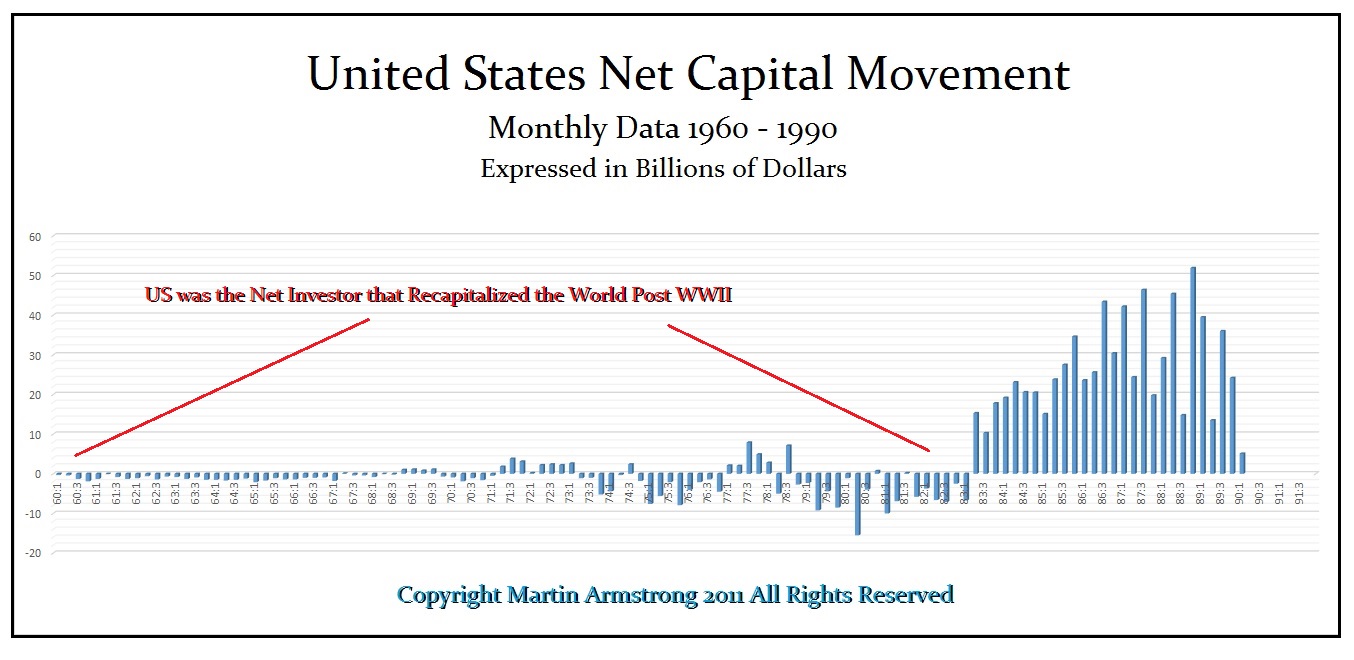
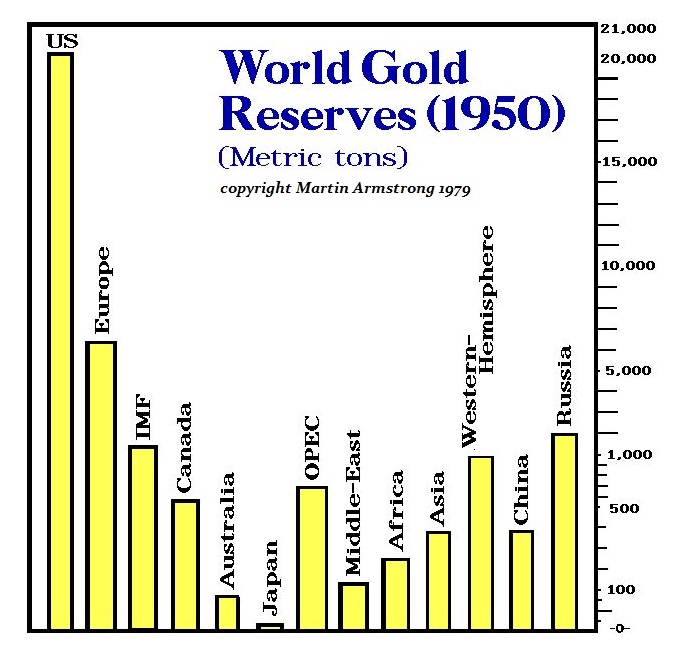
The gold bugs spun the tail that China was going to save them by making gold $50,000-$100,000 an ounce because money, in their minds, has to be tangible. However, China’s $3 trillion-plus in foreign currency reserves was the biggest stockpile in the world, They had no such intention of swapping it all for gold. As a percentage of global capital flow, China’s reserves reached 31% of total world reserves which dwarfs everyone else. Nevertheless, it still does not match the USA in 1950 after two World Wars. What made the dollar THE DOLLAR was the fact that by the end of World War II, the USA held 76% of total global reserves among nations. Nobody has ever reached that level again.
The argument that money must be TANGIBLE and backed by something has been exposed as false. One would have assumed that China’s massive foreign exchange reserves were as good as gold, providing an insurance policy against the country’s decline. However, the yuan has been a depreciating currency as a torrent of capital leaves the country. Indeed, Japan and Germany rose from the ashes without gold following the war. China also followed the same path, which proves that the wealth of a nation is its people and their total productive capacity.
ConcentrationCapital
The crisis brewing in China is the same pattern that unfolded after the concentration of capital within the USA following World War II. It was the migration of capital out of the USA that rebuilt the world. The Chinese are off doing the very same thing that the Japanese and Americans did after capital concentrated into their countries. Some are shocked at the alarming rate of dollars fleeing the country from the People’s Bank of China. China’s stockpile of foreign exchange reserves plunged by $513 billion (13.4%) during 2015 when it fell to $3.33 trillion as the nation’s central bank tried to manage a weakening yuan. This resulted in American politicians calling it “currency manipulation”, which reveals how stupid they truly are when it comes to international capital flows and the global economy. An estimated $843 billion in total capital left China between February and November last year alone.
USA Net Cap 1960-1990 Annotated
Brutus-Bust
Historically, this pattern is standard and ALWAYS unfolds no matter what country we are looking at. I wrote about the ancient Wall Street of the Roman Empire in its day, known as the Via Sacra (Sacred Road). Cicero (106-43 BC) wrote that anytime there was news of a disaster in Asia Minor (modern Turkey), a financial panic would be unleashed in the Roman Forum on this very street. Why? Because the Romans followed the same pattern. As they conquered new lands, they turned them into emerging markets for investment. Cicero tells us that the infamous traitor Brutus (85-42 BC) had lent money to the King of Cappadocia (Turkey) and to the city of Salamis at a 48% rate of interest.
WorldEconomy
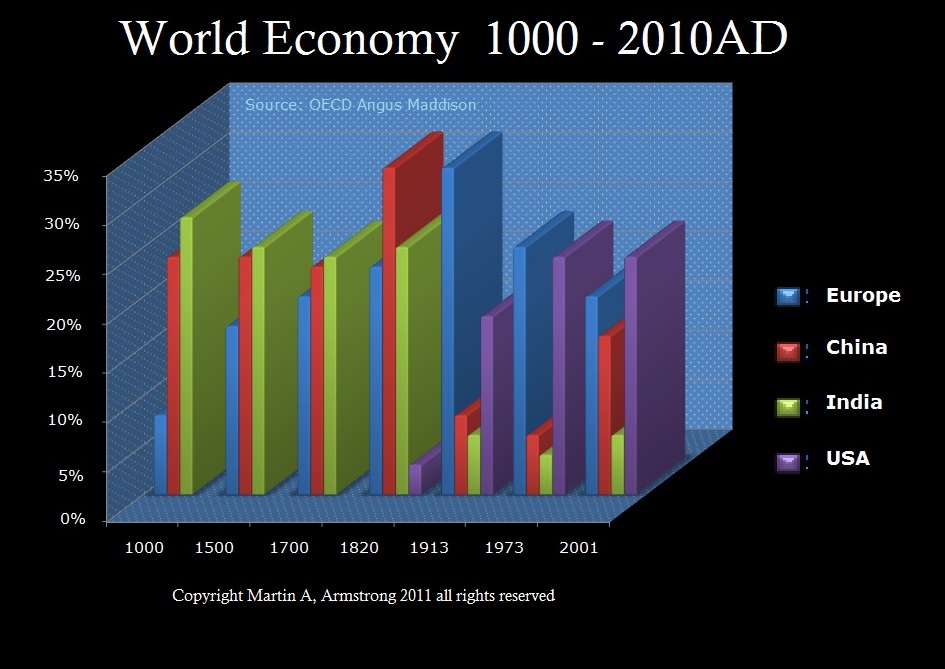
Capital flow has been the key to understanding the world economy. Money has ALWAYS moved for international investment. “Money” is really anything as long as it becomes an agreed unit of account. During the 5th Century AD, Saint Patrick, upon his arrival in Ireland, found that money was expressed in human slave girls. He wrote in his “Confession”, “I think that I have given away to them no less than the price of fifteen humans.” This passage shows something very important. First, money is not defined as a medium of exchange exclusively. Second, it serves the purpose of a unit of account. One did not go shopping dragging a bunch of slave girls; it was simply the unit of account, just as $1 million is a unit of account that does not physically exist as a single bank note. Money has moved around the world for prices in the outer-rim are always cheaper than in the core. Like New York City vs. Kansas or London vs. Manchester or Liverpool. This is what has been behind the rise and fall of nations for recorded history.
Money-Assets
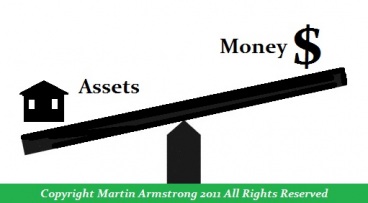
The historical battle has not been gold against intangible forms of money. It has always been private v public. Even if a nation declared gold to be $100,000 an ounce, that is stillFIAT which is anything declared by a government against the free market. A currency peg is FIATVALUE of assets rise against whatever is money so money declines in terms of purchasing power. Deflation is when assets decline against money. The two areALWAYS on opposite sides.
Gold-FluctuatedGold declined in purchasing power when it was money during the 19th century which proves the point. Money and assets are always on opposite sides. When even gold was money it was not this miracle stability within an economic sea of chaos. The problem has NEVER been what is money – the real problem has ALWAYS been government mismanagement. So returning to a gold standard would never make politicians honest since we had Bretton Woods and they blew that gold standard up as well. Let’s stop focusing on what is money and pay attention to who really causes the wild swings in the business cycle and creates war – they are one group which always want to rule the world.
GC-HoldingsRight now, even Brazil is way above most countries holding 3% of world global reserves and Saudi Arabia has 6% while Switzerland comes in at 4%. Algeria has 1% as does Canada, Denmark, France, whereas Germany stands at 2% along with Mexico and Hong Kong beats that at 3% as does India, Russia and the USA. Japan has 10% of world reserves and it is not helping them at all. Looking at RESERVES, reveals that even reaching 31% does not provide security against an economic decline any more than the USA reaching 76% of world gold reserves following World War II.
Tax RobberyThe proof that government is INCAPABLE of managing the economy is the mere fact they keep raising taxes.  If I managed your money and each month I lost and kept coming back asking for more because this time it’s different, how long would you keep handing me more money when I never provide any return?
Welcome to the way government manages our economy. They always run out of your money and constantly raise taxes blaming the rich for making too much.

The Euro & 2017 — The Beginning of the End

Posted in Uncategorized | Tagged ,

Posted on by   


IBEUUS-Y 1-9-2016


The closing for the euro at 10869 provided the long-term Yearly Bearish Reversal that we have cited
throughout the year: “We have Yearly Bearish Reversals at 11645 and 10365. So the 116 level will remain as reactionary resistance this year and the 10365 level is key support just below the current low of 10460.”

The 116 level remains the reactionary resistance target. That is what we should look at for any rally if we are looking to sell this currency. Nevertheless, we do have an initial Weekly Bullish at the 11055 area and a small gap up to the 11365-11375 area. It may be difficult to get through that level of resistance.


IBEUUS-W 1-9-2016


We can see that the oscillator has showed a recovery to some extent. We have not achieved any of the sell signals so far. We still have the Weekly Bearish at 105.20 so we have seen nothing but consolidation to date.

The fact that we closed 2015 below the 116.45 Yearly Bearish Reversal confirms that the trend is down long-term. We held the major Bearish at 103.65, which signaled that we may not see an early conclusion to this trend either. So here too, we may not see a low in the euro (high in the dollar) before 2018, at best, with the potential for an extension into 2020/2021.

In the stock markets, crude, the euro, and the Chinese economy are looking into 2020 and the potential that Japan will collapse into a full Pi Cycle of 31.4 years from the 1989 high, which would also put this into the 2020 time slot. We must keep an eye on the War Cycle that heats up in 2017. Such periods of conflict, on average, last about three years for a single nation. World War I lasted 4.291 years (about half of an 8.6-year cycle), and World War II, when combined between Europe and Asia, lasted 5.953 years. Therefore, if we were to see an international war from 2017, one would expect it to end by 2021. This War Cycle also has the domestic civil unrest component hitting it simultaneously, and appears to rise sharply following 2017 during the year of major political change.

Therefore, the markets appear to be telling us there is an extension in the wind when we look at all of them across the board. Gold also avoided the key sell signal at 1044 for the closing of 2015 and bottomed on the first Benchmark. This too was like crude — not a buy signal, just an avoidance of a near-term sell signal and hence the bounce. Nevertheless, unlike crude which elected a Yearly Bearish at the 41 level that warned of no new record highs, gold has never elected a Yearly Bearish so new highs remain on the horizon moving forward.

Everything is starting to imply that this is NOT going to END in 2017, however, it is starting to appear that this will be the BEGINNING of the end. So we still see that the opportunity to sell the euro will arrive as will the time to finally buy the Dow. Neither have given us a signal just yet, so it looks like we may get to sell the rally in the euro and buy the low in the Dow.

Crude - slingshot vs. the Phase Transition


Crude Bullish or Bearish?

Crude-Y 1-9-2016

We had THREE Yearly Bearish Reversals in crude: the first was $41, the next $35 and $32, but then
there was also $25. We achieved the first one but not $35. This warns of lower lows here in 2016, but it does not imply $12. Typically, when you trade BELOW a Yearly Bearish like $35 and rally to close above it, it is NOT a buy signal since you are still electing the $41. However, it does warn that a complete collapse is not likely.

This is most likely reflecting what is coming after 2017. This, in part, is also intermingled with the slingshot vs. the Phase Transition. The former would EXTEND the cycle and suggest that 2017-2020 would be the chaotic period; a Phase Transition would imply a conclusion by 2017. That is the difference. Neither one is yet confirmed as we have been stating. Therefore, it is curious that this seems to be lining up with crude.

We have technical support during 2016 in crude at the $30.75 level. Our model shows resistance at $40 and support at $25. Therefore, it does not appear that we would see crude collapse to the $10-$15 level that some have been calling for. This is most likely why crude rallied to close above the $35 number. It merely avoided a devastating sell signal where at least $25 would have been guaranteed.

Using Reversals


Define-Gap
S&P500 Futures
S&P500 Futures
QUESTION:
Hi ! …
In assessing a Sling Shot Move vs Phase Transition, you mentioned that “The key will be decided by the Monthly Bearish Reversals.”
As the market is currently selling off into one of a few support zones, wouldn’t it be decided by Bullish Reversals? In other words, don’t we now want to wait and watch for a Bullish Reversal before we Buy?
Ready for your Trader Service.  :)
All the Best ,
AH
GCNYNF-M 1-9-2016 REVERSALS
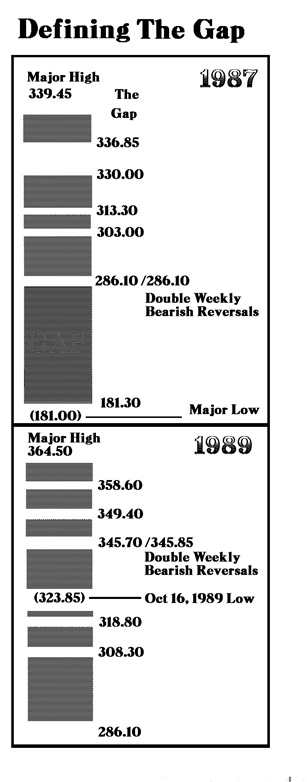
ANSWER: Reversals can be used in two ways. First, as shown above, you can add with each reversal until the trend changes. This illustrates JUST the reversals and only on a one-time level. You can build a position using the broader ones and then exit using the Daily or Weekly.
On the other hand, you can use reversals in the opposite manner for the initial entry. During the 1987 crash, we fell all the way in two days by about 10,000 basis points filling the gap between the reversals. You can buy against that Bearish when it also matches the time. In 1998, I did the same in reverse. I sold the Japanese yen at 147 against the Yearly Bullish, for it too met the time.
If we see a Slingshot (WHICH IS STILL NOT CONFIRMED), then we buy against the Bearish if it meets the time. The same would be true in gold. This is the INITIAL entry. Thereafter, you add to the position with each reversal elected.