Tuesday, January 30, 2018

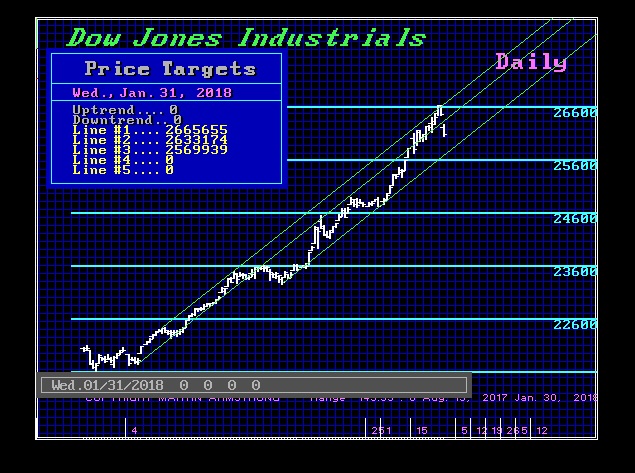
Elected the first Daily Bearish Reversal three more to go before we can say we are headed into a March low

The Dow Down & Dirty


COMMENT: OK Mr. Armstrong. Looks like the government was right. You come out and said the Dow reached a turning point and it crashes. You posted: “In the US Share Market, this is now a turning point we have reached. I have warned for months that exceeding the November high would lead to a January high.” You are too influential.
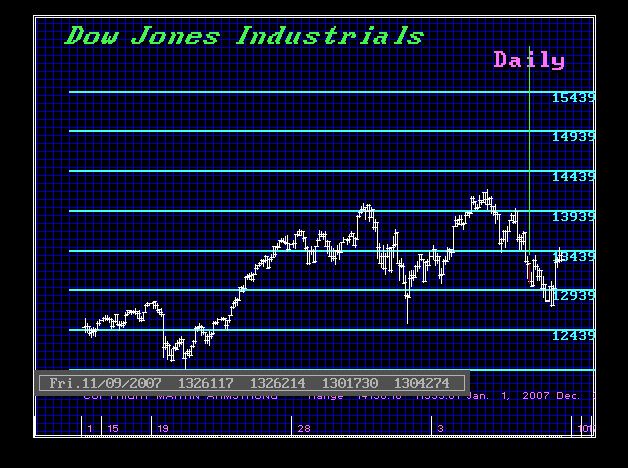
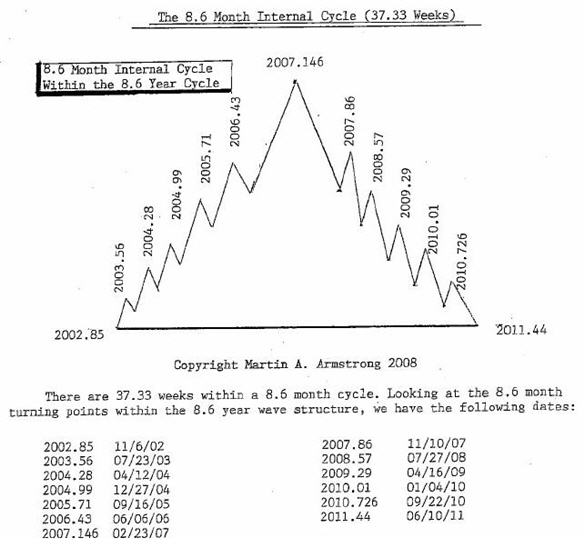
REPLY: Or perhaps our models are correct. This nonsense that people can move the market is absurd. Governments have spent trillions and failed. Why is it I am the only person who can move the world? Does a tree make a sound when it falls in a forest even when nobody is there to listen? They tried to silence me yet it still did not matter. Here is the internal 37.33 week. The target date 2007.86 was November 9th/10th. It was November 9th, 2007 that all four Daily Bearish Re4versals were elected from the major high.
So far, we have elected the first Daily Bearish Reversal. There are three more to go before we can say we are headed into a March low. Time will tell. It should be choppy for the next couple of weeks. When you gap lower like this, you normally will bounce and eventually fill that gap. So caution is always advisable.
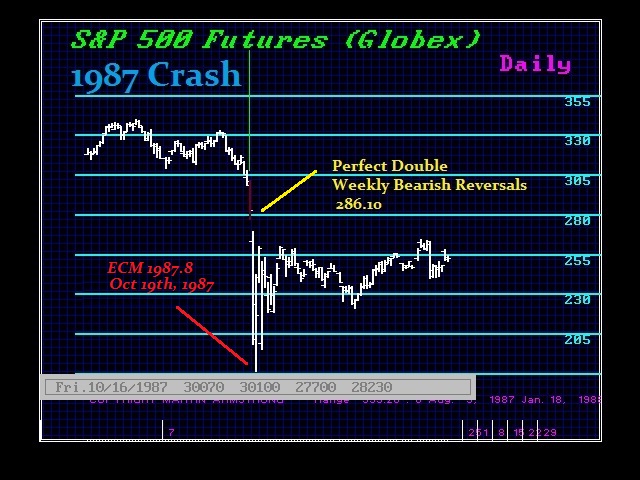
The first high was the precise day that the Real Estate market peaked. They called that Armstrong’s Revenge on the trading floor that day. That was again precisely to the day and that same calculation produced the very day of the low during the 1987 Crash. Markets peak and bottom in sync with our models around the world even when I do not mention them. Sorry – there is just something beyond the surface that warrants our attention. These dates are not random. They cannot be fudged

CFTC Has Made Spoofing a Crime


The Commodity Futures Trading Commission announced that it has brought a case in conjunction with the Department of Justice and Federal Bureau of Investigation’s Criminal Investigative Division, charging criminal and civil enforcement actions against three banks and six individuals involved in commodities fraud and spoofing schemes, which they define as bidding or offering with the intent to cancel before execution. The problem with now claiming to spoof is a crime, they are dangerously destroying how markets have traded from the beginning and this is only reducing the liquidity. That means in the years ahead, during a crisis, there will be fewer and fewer big players left in the markets and that will become dangerous. The government tries to spoof itself during a panic and always comes out and says the market is fundamentally sound to try to stop a panic. They simply write a rule and it becomes a crime that is contrary to a Democratic form of government. Any crime should ONLYbe authored by Congress – not agencies.
We use to call that “flash” bids or offers. It was simply a way of trading that was often mandatory. Of course, there was the risk that you could be tagged. I was short one time in gold about 5,000 lots and it was a turning point so I wanted to cover and flip to a long position. There was a large local trader in the pit. His style was to do these flash offers or bids to try to push the market to the next level. I instructed my guy on the floor to just wait for him and as soon as he would flash offer a thousand lots, buy them. He flashed 1,000 and I said done. He then flashed 1,000 again and I said done. He tried a third time 1,000 and I said done. Gold then rallied. It is one thing to bid or offer and you are not willing to take that position. I seriously doubt that anyone in their right mind would do that. If you are going to flash bids or offers, you can also be tagged and you have to be good for the trade.
The CFTC is totally destroying the market and liquidity. They filed charges and settled charges against Deutsche Bank AG (DB AG) and Deutsche Bank Securities Inc. (DBSI) (collectively, DB), requiring DB to pay a $30 million civil monetary penalty and to undertake remedial relief. The traders were between February 2008 and continuing through at least September 2014, in precious metals. They call this a scheme to manipulate the price of precious metals futures contracts by utilizing a variety of manual spoofing techniques with respect to precious metals futures contracts traded on COMEX, and by trading in a manner to trigger customer stop-loss orders. This is how the markets have traded since inception.
The CFTC also charged and settled against UBS AG(UBS), requiring UBS to pay a $15 million civil monetary penalty and to undertake remedial relief.  Again, this was concerning precious metals futures contracts traded on COMEX.
The third charge was an Order filing and settling charges against HSBC Securities (USA) Inc. (HSBC) for engaging in numerous acts of spoofing with respect to certain futures products in gold and other precious metals traded on COMEX. HSBC was ordered to pay a civil monetary penalty of $1.6 million.
The CFTC Division of Enforcement Director James McDonald said:
“Spoofing is a particularly pernicious example of bad actors seeking to manipulate the market through the abuse of technology.  The technological developments that enabled electronic and algorithmic trading have created new opportunities in our markets.  At the CFTC, we are committed to facilitating these market-enhancing developments.  But at the same time, we recognize that these new developments also present new opportunities for bad actors.  We are equally committed to identifying and punishing these bad actors.  The CFTC’s enforcement program is built around the twin goals of holding wrongdoers accountable and deterring future misconduct.  We believe these goals are best achieved when we hold accountable not just companies, but also the individuals involved.  As these cases show, we will work hard to identify and prosecute the individual traders who engage in spoofing, but we will also seek to find and hold accountable those who teach others how to spoof, who build the tools designed to spoof, or who otherwise aid and abet the wrongdoing.  These cases should send a strong signal that we at the CFTC are committed to identifying individuals responsible for unlawful activity and holding them accountable.”
Saturday, January 27, 2018

The Reversals are the best tool and then the cycles help to hone in on the turning points.

Trading by Systems


QUESTION: Can you trade with the Global Market Watch? Does experience count right now with what you call a Vertical Market?
DS
ANSWER: No. It is an alert to wake you up, not a trading tool. It will alert you to breakouts, waterfalls, highs, or lows. It is not a 100%. It is far better on the major markets than perhaps individual stocks. It can be a great confirmation tool.
Trading this kind of market is probably more dangerous for those who have trading experience. The reason why is they are used to trading normal markets. This is why they have tried to sell every high as the US share market has rallied making new record highs. Their “experience” actually defeats them.
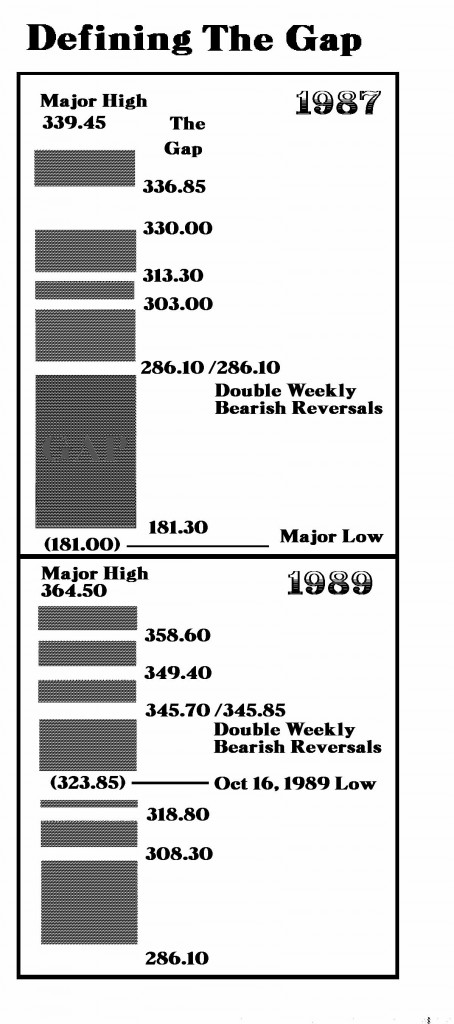
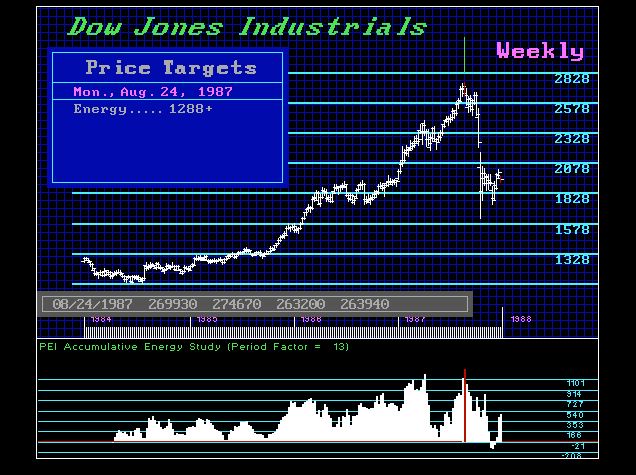
The 1987 Crash was the perfect example. The government was hunting for the person who caused the crash. What they discovered was that they did use computer programs, but they did not follow them because the Dow was down 500 points and they thought there would be a bounce because there was no fundamental explanation. That is when it took out a rare set of Double Weekly Bearish Reversals and we had a gap down to 180 from 286.
The Brady Commission discovered it was not computer trading that caused the crash. It was currency. The big funds unplugged their computers because they did not believe them. So EXPERIENCE can also work against you if you trade especially daily. You see the short moves and miss the big events.

The Reversals are the best tool, and then the cycles help to hone in on the turning points. The Global Market Watch is a pattern recognition model so it is really an alert system that tells you to the look at the detailed reports. We can judge the magnitude of possible moves by looking at the gaps in the Reversal system.

Friday, January 12, 2018

TIME is more than Money – It is EVERYTHING


TIME is more than just money; it’s absolutely everything and then some! Personal opinion just utterly fails because we are all human. Markets routinely do what the majority never expects. That is their function. They mutate like a virus always changing its genetic code to defeat medicine, or in this case, traders. This why most analysts have been wrong. They keep using 1929 as the ideal model and predicting the mother of all crashes to come. They have4 been calling for such a crash since the low of 2009. Every new high was going to be it.
Back on November 30th, 2017, I explained on the private blog: “We must respect that exceeding the November high now in December on a sustained basis, points to a January high. If we pull back, then January will be a low and then watch out for a sharp rally into March.”
TIME is the very fabric of the universe and probably the most misunderstood element of all. In physics, the relativity of simultaneity is the concept that baffles many. The question becomes, do two distant events actually take place simultaneously? Therefore, the question whether two spatially separated events occur at the same TIME is recognized to be far from absolute. It is “relative” depending on the observer’s reference frame. This becomes incredibly important in terms of forecasting the world markets. They tout the mother of all crashes is upon us based upon the events of 1929, 1974, 1987, 2000, and 2007. Yet are these spatially separated events in TIME relevant to the present?
To grasp what our model is really doing one must look at TIME and EVENTS more in the perspective of turning points correlated against everything else on the grid of TIME and PRICE – not specific events standing alone and viewed as singletons. Once you understand we are forecasting turning points on the TIME horizon, not specific events, you will begin to make a leap forward into a new world of understanding TIME and PRICE.
Specific events on the  TIME horizon become easy for forecast based upon the trend in motion relative to TIME and PRICE. When trends reach that TIME horizon event, then a specific high or low is easily ascertained. Right now, we are in the throes of a major breakout that is an inherent characteristic of Vertical Markets. The nature of such events that confound many are what we call the Cycle Inversion process. Normally, turning points unfold in opposite pairs. So a November high would traditionally be followed by a January low. Merely exceeding the November high on a closing basis during December identified the Cycle Inversion process and thus a continued rally into the next target in TIME being January 2018. Exceeding the November high warned we were (1) dealing with a Cycle Inversion, and (2) a Vertical Market that is going to be very difficult to trade for most people.
It is paramount that we understand how Vertical Markets function. This is why we have developed (1) TIMING Models, (2) Reversal System, and (3) our Energy Models. Only by bringing together all three models can we judge the future of any market without human bias. Then it must be correlated both in TIME and PRICE with everything else around it in the world forum to be able to ascertain the waves of CONTAGION that wipe out people emanating from external sources.

Wednesday, January 10, 2018

Extreme Volatility in Weather – Part of Climate Change?


QUESTION: It is crazy hot here in Sydney the exact opposite of the extreme cold in the north. Is there an explanation at all for this?
ANSWER:  Most people do not realize that the climate is actually “polar opposites” so historically when the North is dry, the South is wet or when the North is very cold the South will get very hot. Both the Arctic (North Pole) and the Antarctic (South Pole) are cold because they don’t get any direct sunlight.  However, though the North Pole and the South Pole are “polar opposites,” they both get the same amount of sunlight but there is a major difference. The South Pole is a much colder than the North Pole and this also contributes to the difference in climate experience around the globe.
The Arctic is ocean surrounded by land whereas the Antarctic in the South is in fact land surrounded by ocean. Consequently, the ocean under the Arctic ice is cold, yet the water is still warmer than the ice! So the ocean warms the air which it cannot do in the South. 
Antarctica is dry despite the ice. Under the ice and snow, you find land with mountain ranges, not ocean. As with any mountain range, the higher you go, the colder it gets. The actual average elevation of Antarctica is about 7,500 feet (2.3 km).
The extreme heat in Australian, reached 47c (116f), is more akin to the Middle East in summer. I went trekking through the valley of the Kings in Egypt when it was 50c (122f) and I was the only one out and about while everyone stayed in the hotel. As the energy output of the sun collapses, we will witness growing extremes in different regions. The last time it was this hot in Sydney goes back to the 1930s during the Dust Bowl period in the USA, which hit in three waves – 1934, 1936, and 1939–1940. In truth, the sun cycle began to turn and in 1938 it reached the extremes.
The cycle of extremes in weather appears to be 86 years so this is on target. Australia is dry and ripe for wildfires the same as we see in California. This will contribute to the decline in food supply globally as well. We will see extreme opposites in weather between regions and particularly between North and South.

Sunday, January 7, 2018

Will see England break apart into the old Anglo-Saxon regions

Will England Break-Up Not Just the United Kingdom


QUESTION: Hi Martin.
In your recent blog posts, you talk about the possible timing of the break up of Britain but you talk about that in terms of the regionalisation or break up of England only. Have you not said before that Scotland is likely to become independent sometime in the next few years? Perhaps you could explain how that possibility fits in this process?
Thanks
CGB
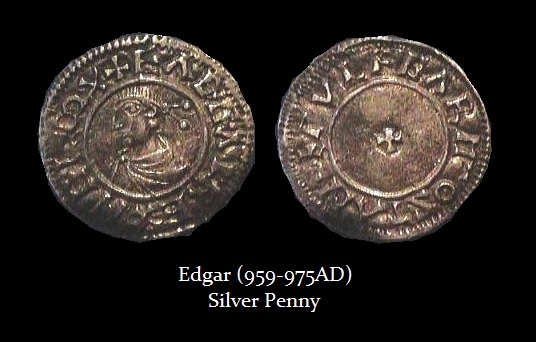
ANSWER: There are two expansions on the island of Britain. The more commonly know is the formation of the United Kington which too place in 1707 under Queen Ann. That saw Scotland under English Rule3. However, before the reign of Eadgar (959-975 AD), England was divided into Anglo-Saxon kingdoms. It was Eadgar who instituted a uniform coinage throughout the land. While Eadgar set the pattern for the ‘reformed’ coinage of the later Anglo-Saxon and Norman period and standardized the use of the king’s portrait as in old Roman tradition.
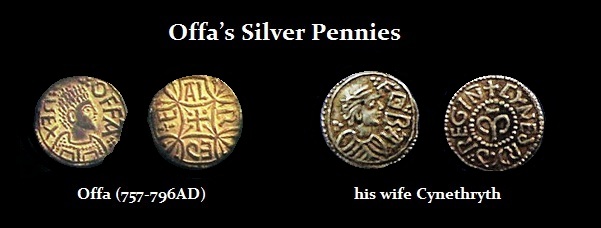
If we look back in time, we see that the first Anglo-Saxon kingdom to really become powerful was Mercia. It was the King of Mercia who was the one who actually resurrected the old Roman Empire monetary system for all of Europe. We see that Offa was the first king to put the portrait of his wife on the coinage as was the tradition in the Roman Empire.
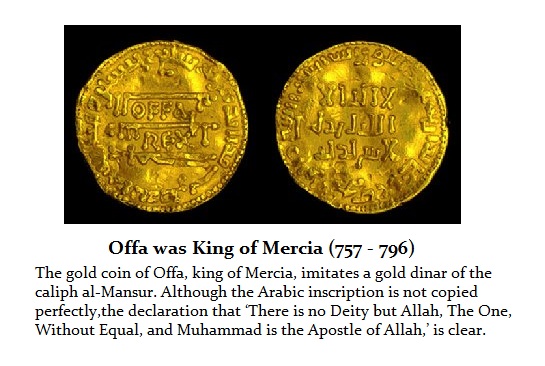
Additionally, it was Offa who actually issued the first gold coin after the fall of Rome. He was copying the Islamic gold coin for trade. He inscribed his name on the coinage, which is extremely rare.
Therefore, there are two break-ups that Britain face. Eventually, the United Kingdom will break apart formally, but with the collapse of Brussels and the EU Project, we are also likely to then see AFTER 2032, the general trend toward decentralization of governments as a whole. Hence, we will see England break apart into the old Anglo-Saxon regions as we will see the United States break apart. This is the cycle of dissolution politically and then you begin again and reform nation-states in the next major cycle wave.

Friday, January 5, 2018

2042-2044 is the likelihood of England breaking apart back toward the regions that were united by Eadgar

Is BREXIT in Trouble? Can Britain Survive Past 2042-2044?


The REMAIN crowd is doing everything possible to surrender the sovereignty, dignity, and future of Britain. The left is taking hold in Britain calling anyone who wants to leave the EU is now openly called a “racist” and they are bashing anyone who even appears to be nationalist.
While the British pound closed 2017 at 13501, it finished the year in a long-term bearish position. We now have politicians rebellion and saying that the question was too complicated for the average person to understand and so the referendum should be put aside. This is keeping in line with the anti-Democratic policy adopted in the EU to deny the people the right to vote on the European Project – the surrender of all sovereignty to Brussels.
Unfortunately, our model has not indicated any change in the long-term trend. The Euro still closed in a bullish position relative to the cross with the pound sterling. Support lies at 88120 for 2018 on Euro/Sterling. We elected a Yearly Bullish Reversal back for the close of 2016 and that has dominated the trend as 2017 closed high with an inside trading year.
The posture, overall, shows that this remains in a questionable position. The early election called by PM May was a disaster and has opened the door for the REMAIN crowd to overthrow the vote by painting anyone for BREXIT as a racist and we now hear the politicians saying that Parliament should decide and not the people. If they succeed in this movement, we seem to be on schedule for the complete collapse of Britain come 2044 where it too will split up into regions as it had begun.

During the reign of Eadgar (959-975 AD), England was united under one ruler. It was Eadgar who instituted a uniform coinage throughout the land. Eadgar set the pattern for the ‘reformed’ coinage of the later Anglo-Saxon and Norman period and standardized the use of the king’s portrait as in old Roman tradition.
Here too, we are reaching 21 cycles of the ECM 51.6-years from the reign of Eadgar, which also confirms independently 2042-2044 the likelihood of England breaking apart back toward the regions that were united by Eadgar will be the fate of Britain.

Energy Models are designed to ascertain Euphoria

At What Point do we reach Euphoria in the Equity Markets?


QUESTION:
Marty,
John Templeton has said “Bull markets are born in pessimism, grow on skepticism, mature on optimism and die on euphoria. The time of maximum pessimism is the best time to buy, and the time of maximum optimism is the best time to sell.” “If you want to have a better performance than the crowd, you must do things differently from the crowd.”
My question is…….. at what point do we reach euphoria in the equity markets?
ANSWER: Our Energy Models are designed to ascertain that dimension of a market. Naturally, everyone responds to whatever the last event is in recent memory. Therefore, the 2007-2009 Crash lives on in their experience so that means they will be skeptical of new highs. We have witnessed that with analysts constantly calling for every new high would be the last. They keep trying to forecast the last event because they missed that one as well.
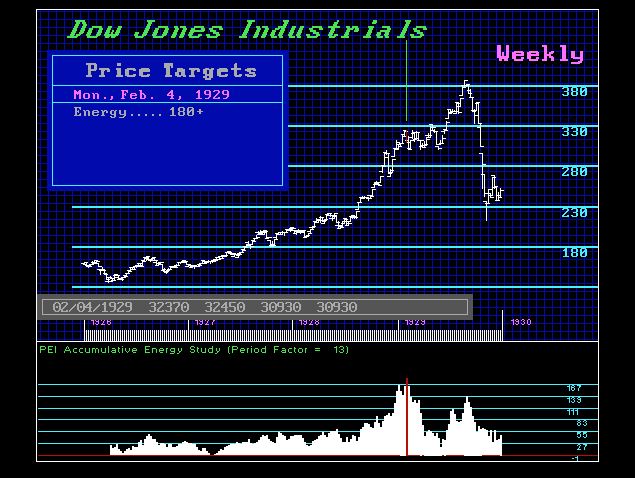
The only way to approach this is from a quantitative viewpoint. Human opinion will inevitably be wrong no matter who it is. How the market responds to our Energy Models is critical for long-term forecasting. Look at the chart for 1929. Here you see that there is a huge spike in energy which peaked in February 1929. The market rallied to new highs but note that the Energy Models we not making new highs. This peak BEFORE the major high confirmed a very serious undermining of the market structure warning that this type of high was a Bubble and therefore would not be exceeded for decades.
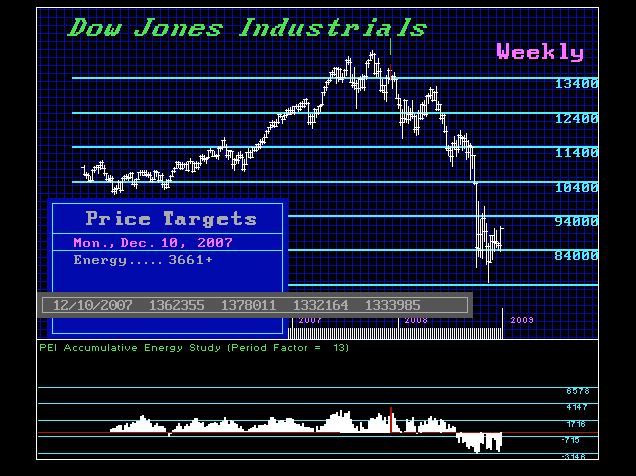
Now compare this to the Energy Models for the 2007 high. We do not have a BUBBLE formation at all and the high came on the reaction high following the major high for the move. This confirmed this was by no means a BUBBLE and in fact new record highs would be make once again.
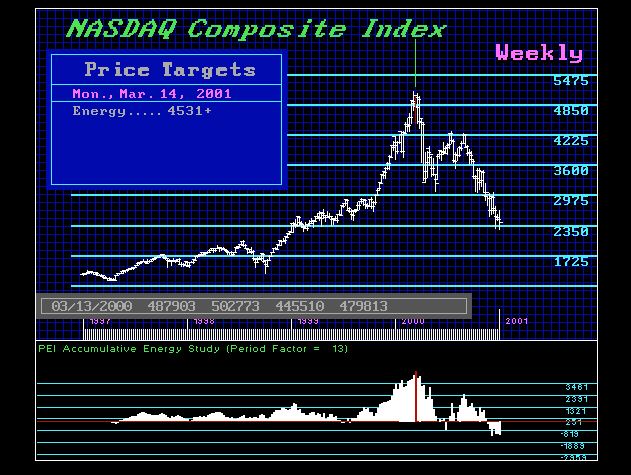
Let’s turn to the DOT.COM BUBBLE. The first thing you will notice is that the Energy was clearly in a BUBBLE formation. The slight difference here is that the Energy Model peaked the week after the high rather than before. This confirmed that it was not going to be a 1929 type event and the new record highs would be made which indeed unfolded in April 2015 which was 61 quarters intraday and 66 quarters to close above the 2000 high on a quarterly basis.


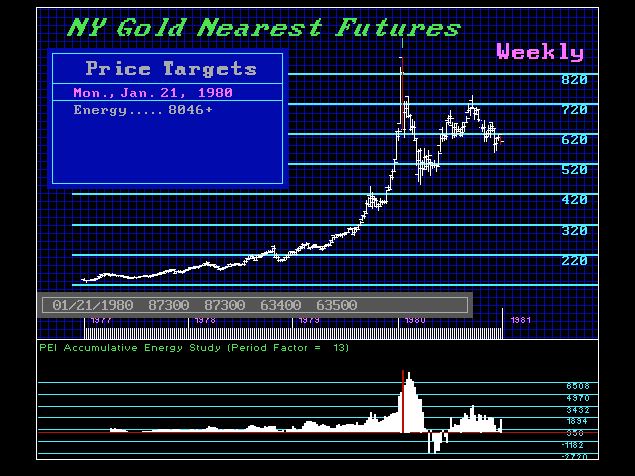
Here is gold for the 1980 BUBBLE. Once again you see the extreme BUBBLE formation and here the peak took place with the peak in gold. So while we are not looking at the same type of formation with the peak unfolding in advance of the high as in 1929, this reflected that gold would eventually make new record highs within a mid-term perspective. Unquestionable, it took 19 years for gold to decline before the major low was established. Gold finally exceeded the 1980 high during the crisis of 2008.


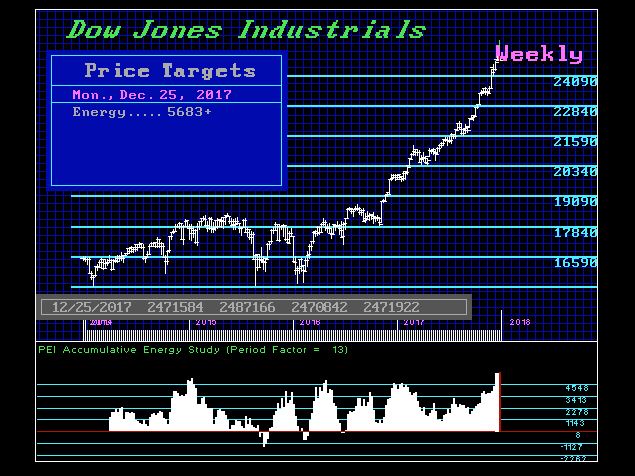
Now, let us look at the current situation. Again we do not have a major BUBBLEformation. What we do have is a market that is still expanding and in fact, the high on our Energy Models on the weekly level took place last week. This implies we would still press higher into January and that has been out target once you exceeded the November high.


We are by no means in a 1929 BUBBLE type of formation. Here is the view of the 1987 Crash. Like Gold, the peak came 1 week following the high. Yet we see escalating advances in Energy leading into the 1987 high. So far, we lack that type of pattern warning that the real advance in our Energy Models is yet to come.
Therefore, the answer to your question is rather simple. It is always a matter of TIME rather than price. As markets rally, human interpretation of price will always be wrong.NOBODY is going to call this final high from a human perspective and anyone who claims that will be a fraud. It is not a matter of opinion for we can personally only forecast what we think is possible, to begin with.