Showing posts with label Energy model. Show all posts

Tuesday, March 3, 2020

How to Determine When New Highs Are Coming


QUESTION: Marty, your explanation of the 1987 Crash and the Nikkei are very informative. Can you elaborate on how we can see that on Socrates?
Thank you for the education
UD
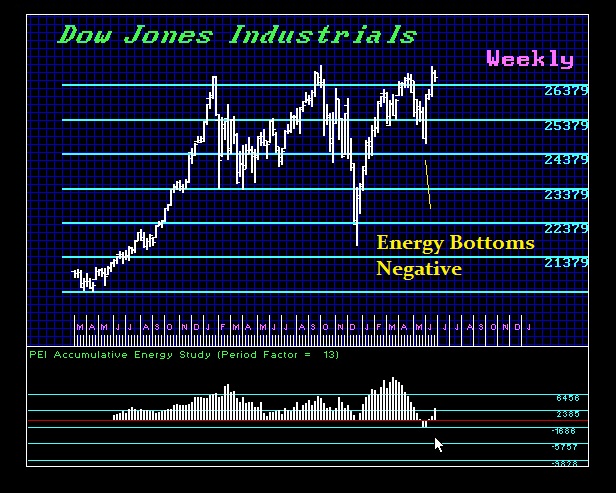
ANSWER: The easiest way to see that is by using the Energy Model I developed. The very purpose of the model is to measure the amount of energy in the system, which is not the same as looking at the price movement of charts thereof.
 
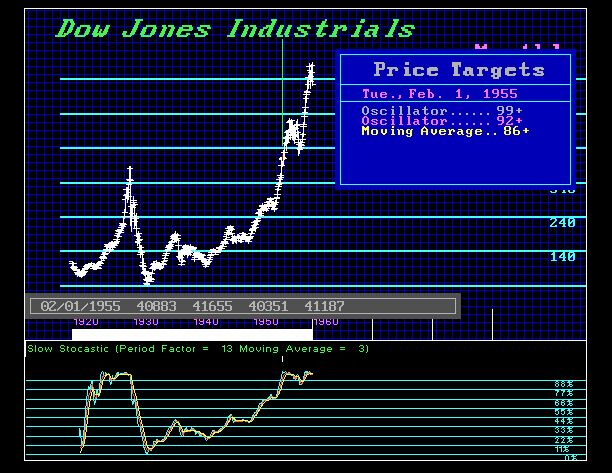
Compare how the Energy Model performed on the Great Depression and then look at the 2007-2009 Financial Crisis. The Dow did not make new highs on the Energy Model until 1954. That took 25 years to accomplish. This was a Public Wave where sentiment shifted to secure government bonds, and equities were viewed as the speculative play toys of the rabble.
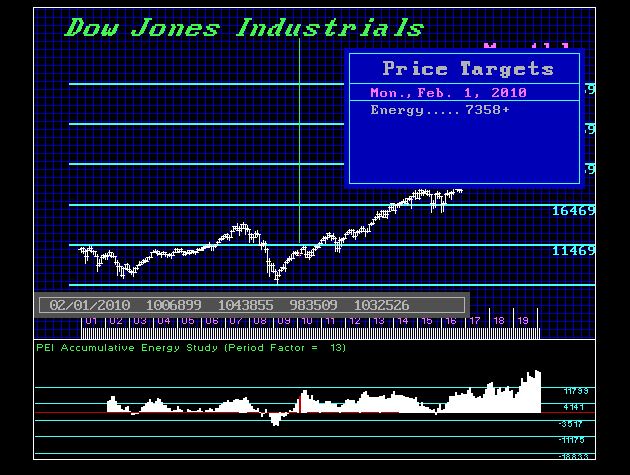
Now, look at the 2007-2009 Financial Crisis. We were making new highs on the Energy Model by February 2010. This confirmed that we would be making new record highs and this became the Most Hated Bull Market in history.
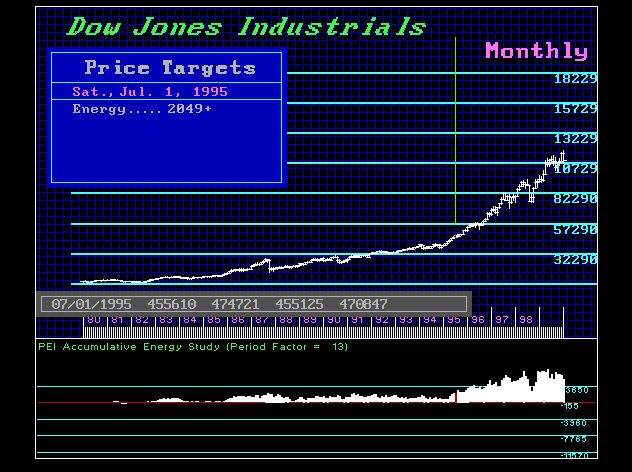
The 1987 Crash was interesting, for the Energy Model continued to make new highs after the market peaked. This was a warning we were dealing with a short-term event, not long-term. However, that high in energy from 1987 was not exceeded until July 1995. From that point onward, the US market began to rally significantly.
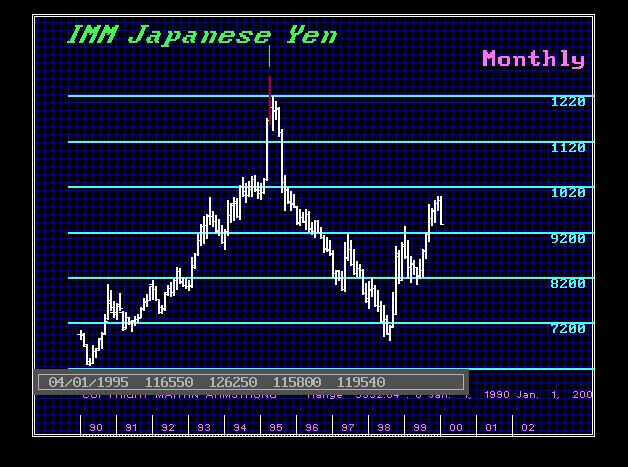
The US share market broke out on our Energy Models in July 1995 while the dollar bottomed against the Japanese yen in April 1995. This also confirmed we were dealing with a capital flow shift that would turn toward the dollar and the US equities.
Our Energy Models were designed to provide a completely different view of market activity. Even if we look at the standard oscillator, it peaked in January 1925 and that was not exceeded even into 1929, It was finally marched only in February 1955. So that was no help in really forecasting the Great Depression or the rally thereafter.
The Energy Model offers a completely different perspective and it has nothing to do with oscillators or moving averages. Moving average convergence divergence (MACD) is one of the most commonly used technical analysis indicators. However, the MACD (26/12) did not cross until June 1930. So this trend following momentum indicator looks at an asset’s momentum to ascertain whether the trend is up or down, but it failed to provide a trading signal that would have gotten you out of the market for nine months after the high. Therefore, oscillators and moving averages can be good confirmation tools, but they are not consistent insofar as providing always an advance warning.

Wednesday, September 18, 2019

Reversals – Energy – A Different Dimension


QUESTION: Hi Marty… I’ve been reading your blog for several years now.
I’ve been trying to understand the basics about your reversal system is with no luck.
Yet I’ve been trading stocks with only simple trend lines for years using basic tech A.
PS I still don’t even understand how the Federal Reserve works either… they don’t teach you that stuff in high school!
Yes, I’ve watched every video or post on reversals on your site and not getting it. I know I’m not that smart but I’m not that dumb either!
Can you pretty please post a very clear layman’s chart using a stock or a commodity with prices like gold to show us dummies so we “GET IT”
Thanks Marty….
A dumb Canuck
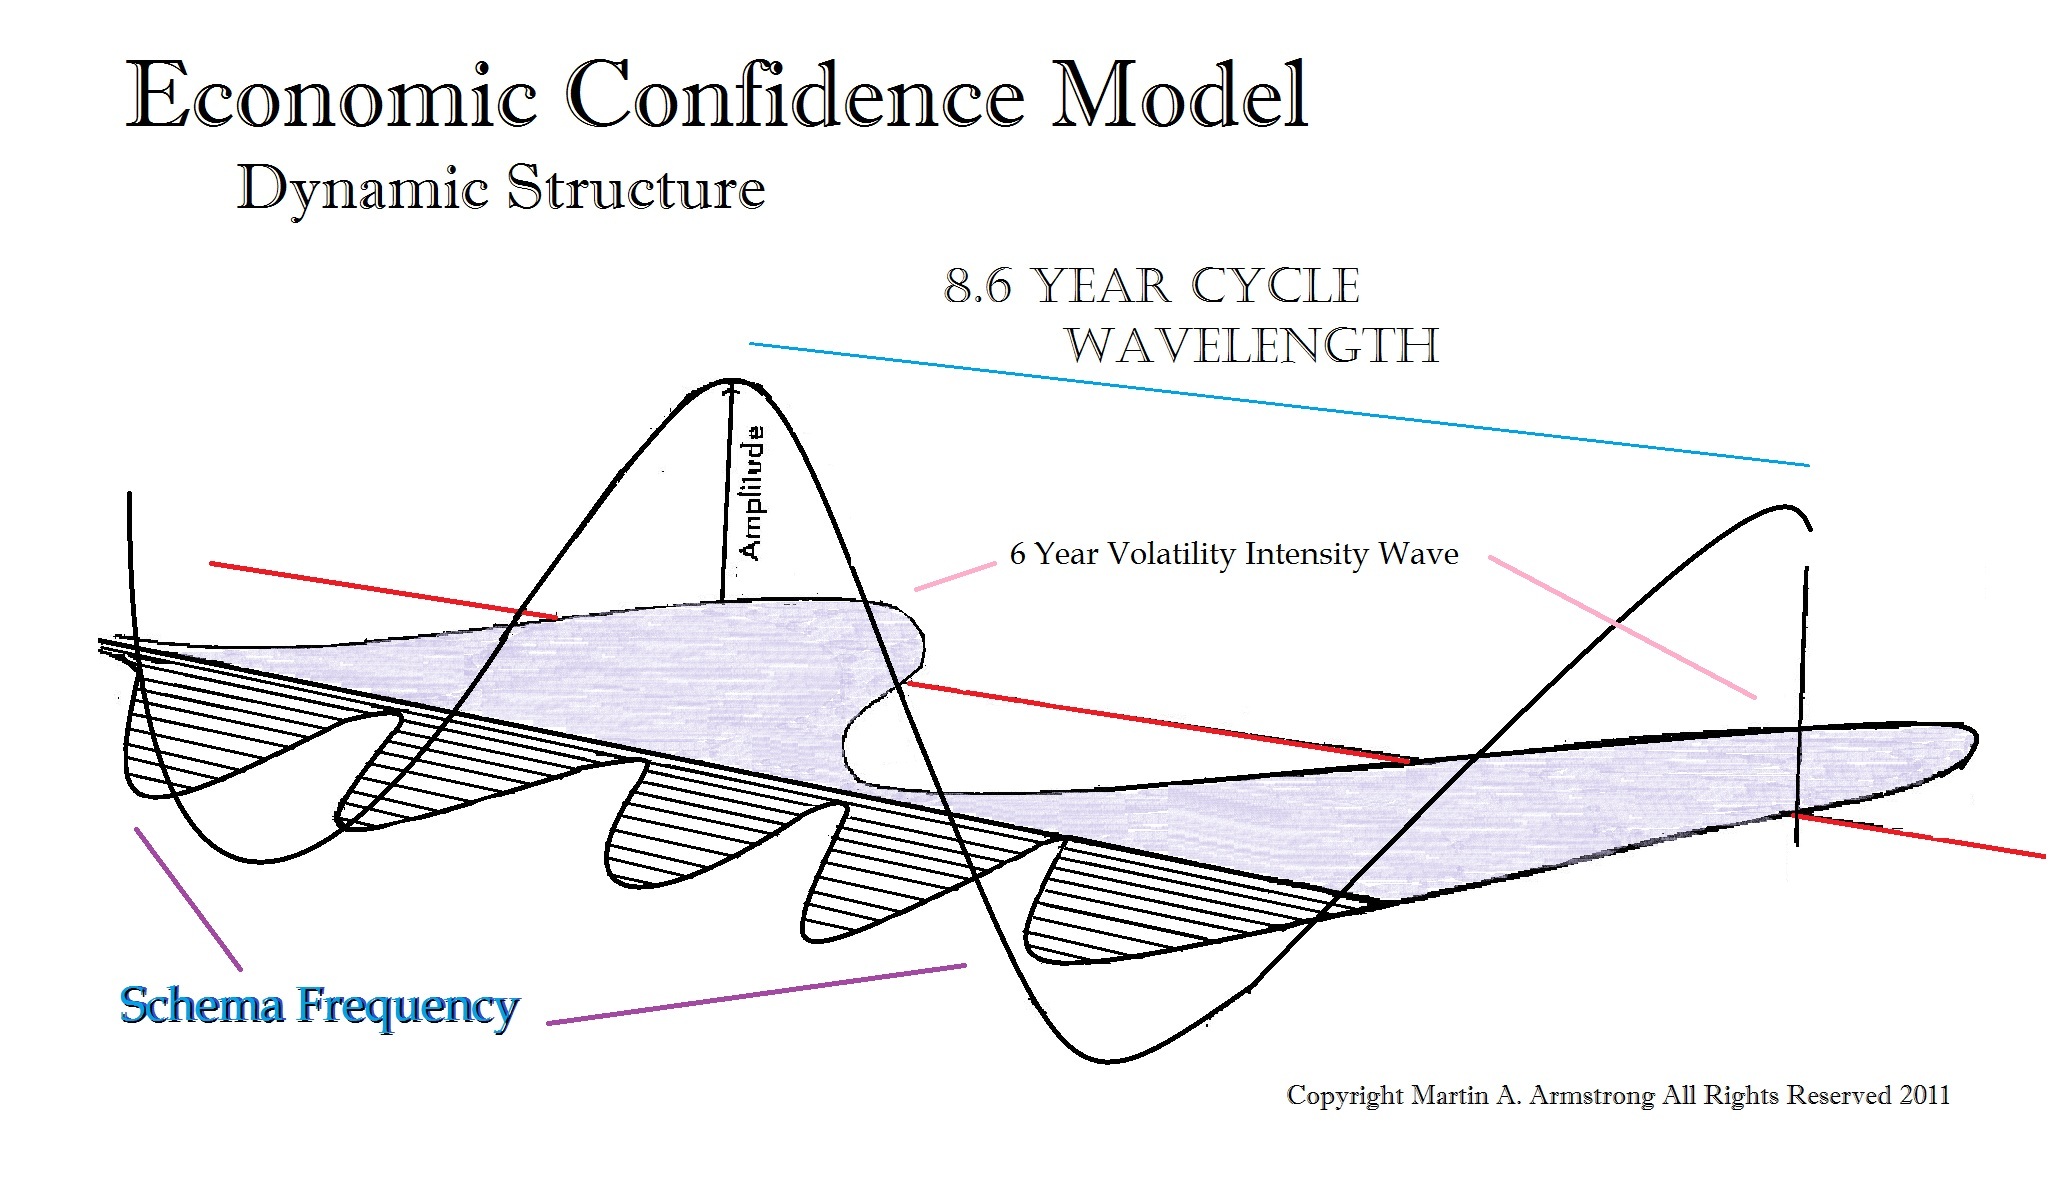
ANSWER: Look, the reversals are a black box and I keep it that way along with the Schema Frequencies. This is a physics solution to how the world ticks. It is not a simple moving average, stochastics, or one-dimensional formula. It is highly complex and many people have tried to reverse engineer it but have failed. They may think they have come close but they cannot account for the next number.
Traditionally, economists argue there is a business cycle, but nobody can forecast the cycle. Therefore, with tools of interest rates, taxes, and money supply, governments can manipulate the business cycle. The problem is that even Larry Summers admitted that he cannot forecast the economy. This stems from the problem of their failure to understand cyclical movement,to begin with. The Schema Frequencies resolve the complexity of cyclical movement.
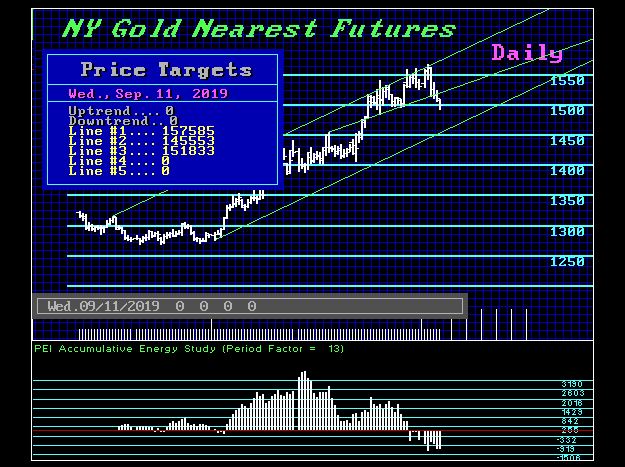
The Energy indicator is against based upon physics and it exposes the true opposing forces at work irrespective of the superficial price levels. The key to this is looking for the divergence when prices are rising and Energy is declining. This is a warning signal that such a rally is NOT sustainable. Likewise, when prices are falling but Energy begins to rise, once more there is a divergence warning that the decline is losing energy and a low is near. Just look at this daily chart on gold. You can see the divergence as Energy peaked well in advance.
These indicators are not your standard variety of analysis. They are entirely beyond the one-dimensional analysis world for the markets are not only all connected globally, but the entire system is fractal. So we have a fractal relationship within each market and then a fractal relationship on a global perspective.
The models do all the calculations that are humanly impossible to carry out before a market even closes. It allows us to stand back and see the overview which then reveals the trends. Many have tried to prevent our forecasts. They have tried to ignore what this computer has been doing in hopes that I will die and that will be the end of it. I see this as a means to an end — to help society manage the business cycle without destroying our human rights and our freedom. I have to protect this because there are those who would use it behind the curtain for personal gain against the world.
Sometimes in life, we stumble upon something like the discovery of penicillin. It has saved lives. People just accept that and do not need to know the formula behind it

Friday, March 9, 2018

Energy Models are not in a position for a major high, rising, not declining as new highs were made...still see higher highs in the years ahead

The Analysts Are Turning Back to Bearish Again


CNN Money is reporting the headline “A top JPMorgan Chase executive is warning that stocks could fall as much as 40% in the next few years.” CNN reports that Daniel Pinto, JPMorgan’s co-president, said on Bloomberg Television he believed that market gains should continue for the next year or two. However, he added that investors were nervous could result in a “deep correction” of between 20% and 40%, “depending upon the market values at the time the downturn starts.”
Indeed, this was the pause we were looking for from January. We did not see a collapse as in terms of 1987. Instead, this is simply the transition period where the marketplace must come to grips with a Sovereign Debt Crisis and that means rising interest rates will devastate the bond bubble. So exactly how does that equate to a 40% decline in equities?
What is clear is that the initial stages of this consolidation period involved the marketplace coming to grips with the shift from PUBLIC to the PRIVATE rationale. In other words, inflation, rising interest rates, the rapid rise in interest rates, explosion in public debt, and the inability of governments to fund their never-ending deficit spending at the federal, state, and local levels. Then as the economy begins to worsen, this will also historically lead to trade wars.
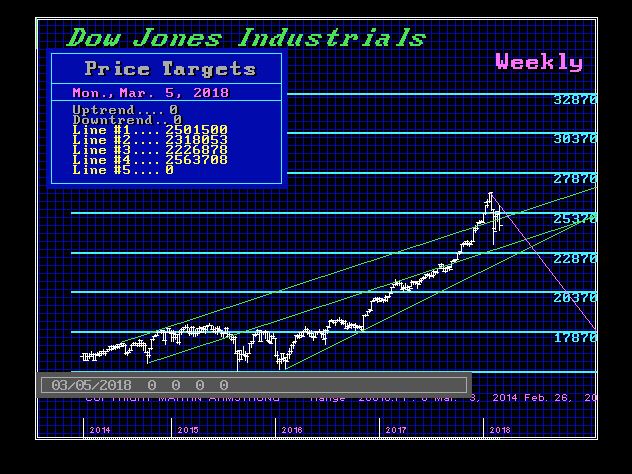
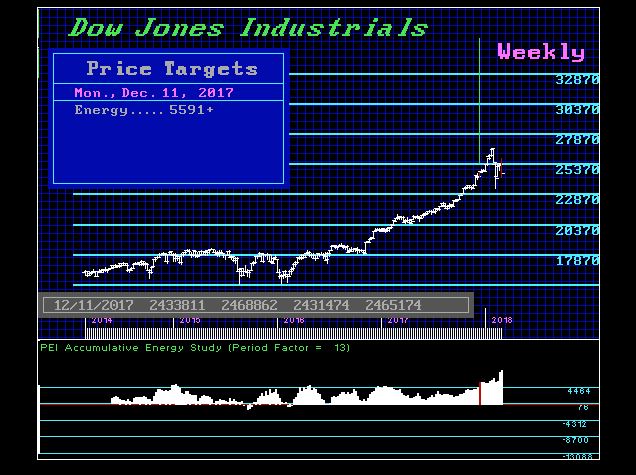
This is good news. We need the majority of analysts to turn bearish in order to restore the upward bias we have enjoyed for the past 8 years. We can see that our Energy Models are not in a position for a major high. They have been rising, not declining as new highs were made. This strongly suggests we will still see higher highs in the years ahead. The more analysts we get back to bearish, the strong the breakout to the upside later on.

Friday, January 5, 2018

Energy Models are designed to ascertain Euphoria

At What Point do we reach Euphoria in the Equity Markets?


QUESTION:
Marty,
John Templeton has said “Bull markets are born in pessimism, grow on skepticism, mature on optimism and die on euphoria. The time of maximum pessimism is the best time to buy, and the time of maximum optimism is the best time to sell.” “If you want to have a better performance than the crowd, you must do things differently from the crowd.”
My question is…….. at what point do we reach euphoria in the equity markets?
ANSWER: Our Energy Models are designed to ascertain that dimension of a market. Naturally, everyone responds to whatever the last event is in recent memory. Therefore, the 2007-2009 Crash lives on in their experience so that means they will be skeptical of new highs. We have witnessed that with analysts constantly calling for every new high would be the last. They keep trying to forecast the last event because they missed that one as well.
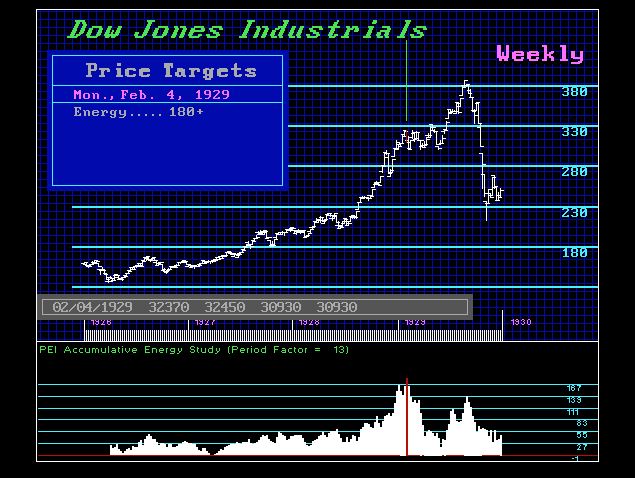
The only way to approach this is from a quantitative viewpoint. Human opinion will inevitably be wrong no matter who it is. How the market responds to our Energy Models is critical for long-term forecasting. Look at the chart for 1929. Here you see that there is a huge spike in energy which peaked in February 1929. The market rallied to new highs but note that the Energy Models we not making new highs. This peak BEFORE the major high confirmed a very serious undermining of the market structure warning that this type of high was a Bubble and therefore would not be exceeded for decades.
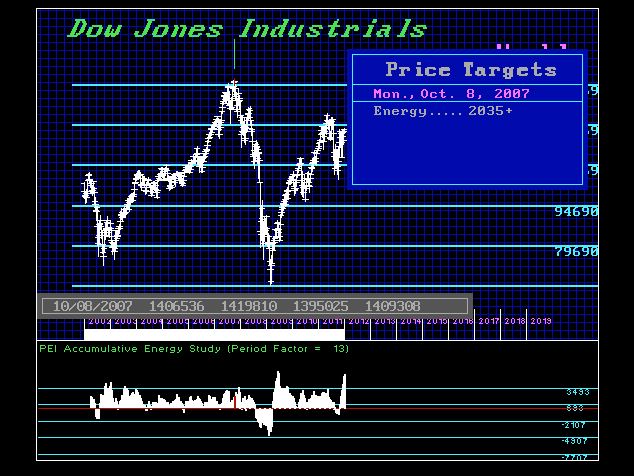
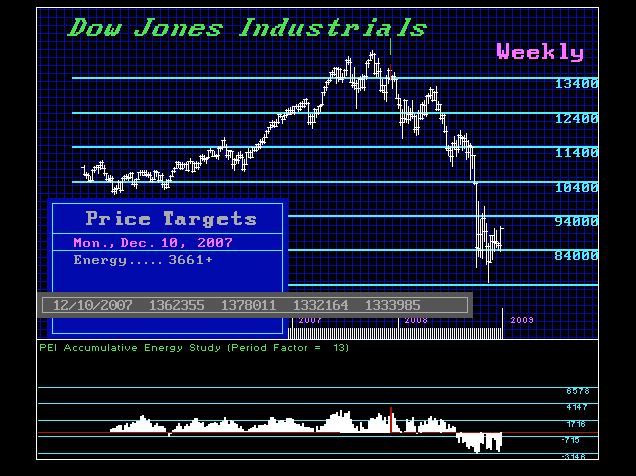
Now compare this to the Energy Models for the 2007 high. We do not have a BUBBLE formation at all and the high came on the reaction high following the major high for the move. This confirmed this was by no means a BUBBLE and in fact new record highs would be make once again.
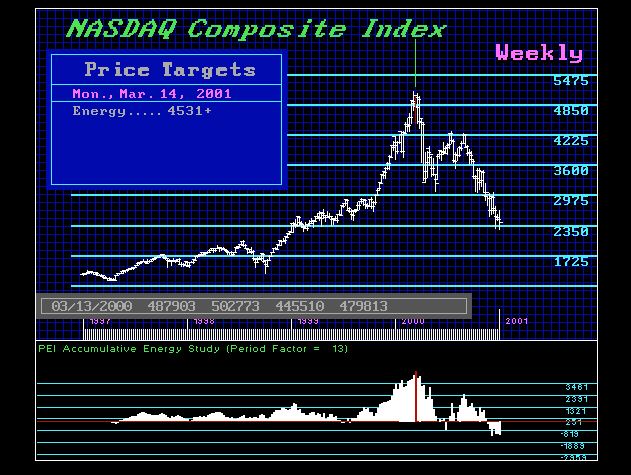
Let’s turn to the DOT.COM BUBBLE. The first thing you will notice is that the Energy was clearly in a BUBBLE formation. The slight difference here is that the Energy Model peaked the week after the high rather than before. This confirmed that it was not going to be a 1929 type event and the new record highs would be made which indeed unfolded in April 2015 which was 61 quarters intraday and 66 quarters to close above the 2000 high on a quarterly basis.


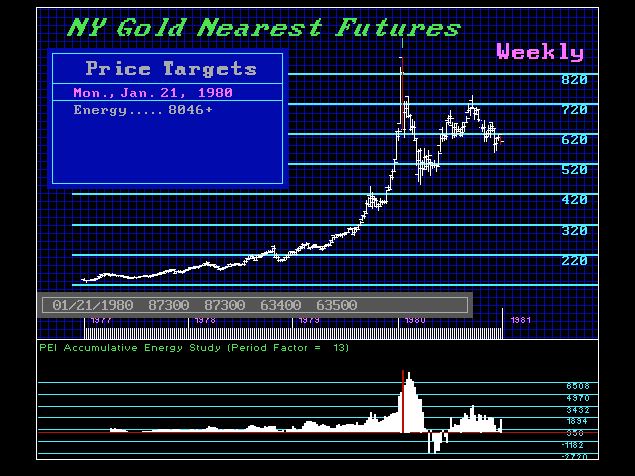
Here is gold for the 1980 BUBBLE. Once again you see the extreme BUBBLE formation and here the peak took place with the peak in gold. So while we are not looking at the same type of formation with the peak unfolding in advance of the high as in 1929, this reflected that gold would eventually make new record highs within a mid-term perspective. Unquestionable, it took 19 years for gold to decline before the major low was established. Gold finally exceeded the 1980 high during the crisis of 2008.


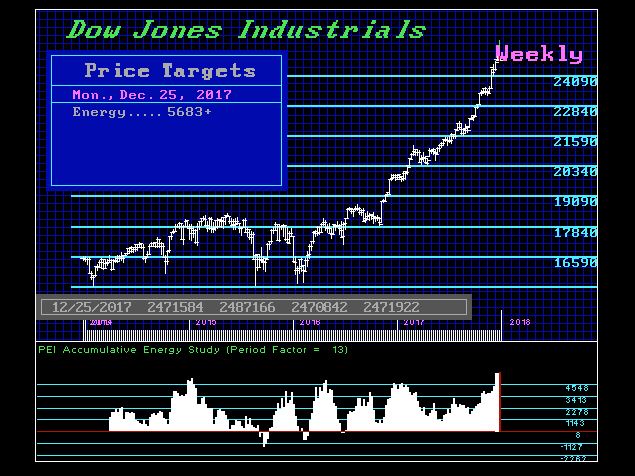
Now, let us look at the current situation. Again we do not have a major BUBBLEformation. What we do have is a market that is still expanding and in fact, the high on our Energy Models on the weekly level took place last week. This implies we would still press higher into January and that has been out target once you exceeded the November high.


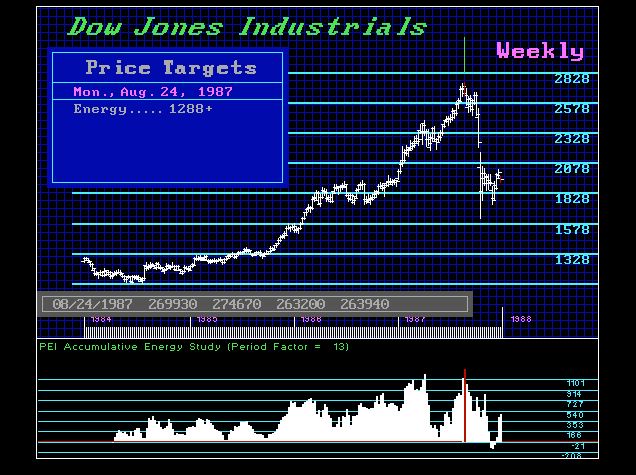
We are by no means in a 1929 BUBBLE type of formation. Here is the view of the 1987 Crash. Like Gold, the peak came 1 week following the high. Yet we see escalating advances in Energy leading into the 1987 high. So far, we lack that type of pattern warning that the real advance in our Energy Models is yet to come.
Therefore, the answer to your question is rather simple. It is always a matter of TIME rather than price. As markets rally, human interpretation of price will always be wrong.NOBODY is going to call this final high from a human perspective and anyone who claims that will be a fraud. It is not a matter of opinion for we can personally only forecast what we think is possible, to begin with.

Wednesday, February 18, 2015

ECM - Energy Model

Entropy – ENERGY & More

Modulation
QUESTION: Hi Marty…as a long time reader and communicator of your work and with you, ive learnt a great deal since 2008/09 when i first picked up your typewriter written reports….however something has piqued my curiosity lately reading your blog posts.
1) Youve been talking alot lately about the “energy model’, i think alot of us are quite intrigued and curious about this. Could you perhaps elaborate more about this model, and for the more technically savvy folks, could you delve into a little more detail about what it measures and how it does this? I am certain this is not a simple price action oscillator.
2) You mentioned about a transverse wave, expansion and contraction in one  of your recent blog posts, compared to fixed waves of benchmarks. Is this transverse wave the ECM? or is there some other wave you are referring to? The long time readers and fans of your write ups would love to have you elaborate in some detail about your reference of the transverse wave in the markets.
Thank you
Regards
R
Socrates-IPad


ANSWER: Long established clients know while I was a trader, I went through computer engineering in the good old days when you have to do both hardware and software. So I took those skills and applied them in trading. The boys on Wall Street only knew I had a physics background so they started higher people with those degrees. They failed to comprehend that writing a program is just learning how to read and write. You then have to have some knowledge of what you are going to write about.
I applied physics far beyond what most people would even do. My view was always I had no idea so lets just see what emerges. Approaching the markets as a child open to learn rather than trying to prove a theory is a huge difference. The former you are opened-minded and latter you will learn nothing.
DECLSILV - MA-Waterfall
I realized as a trader, that for a model to hold up, I had to test it under all circumstances – not just back to 1971. Those who won Nobel Prizes like Black & Scholes never had the database to prove their formula would not meltdown in a panic. That is why Long-Term Capital Management collapsed in 1998.
I realized I needed data. So I spend vast sums of money to reconstruct the world monetary system from inception. I uncovered how empires truly rose and fell crumbling into dust. The real eye-opener was the fact it was a crash in burn not a long slow gradual decline.
huygensI applied physics on the assumption that the laws of nature applied to everything. What began to appear before my eyes was indeed a key building block upon which everything was constructed from planetary movement to the rise and fall of empires and markets. There was a core element and that wave motion and TIME. Now I was into the realm of Newtonian Physics and the father of cycle theory, Christiaan Huygens (1629-1695) who was a Dutch mathematician, astronomer, and a physicist. He has truly been lost to history, perhaps overshadowed by Isaac Newton (1642-1727) and Albert Einstein (1879–1955), yet whose work has had a long lasting impact upon society to this very day.
Sidewinding SnakeHuygens’ discovery was fundamental. How does ENERGY actually move? This might not sound like much at first. Nonetheless, the natural assumption that everyone seems to make in thatENERGY moves in a straight line. What if that is wrong! What if ENERGYmoves more like a side-winding snake that moves rapidly, but it takes less energy for it to move in this fashion than in a straight line. When you stop and think about life in detail, you realize that you also do not function in a linear fashion. You need ENERGY to sustain life by eating and drinking in a cyclical manner, and you need to sleep to restore that ENERGY. We do not move in a constant steady straight line either.
Huygens is the man that discovered that light itself moved like that side-winding snake in a cyclical wave motion and not in a straight linear line. Perhaps it was his diverse observations that enabled him to discover the nature of how light actually moves.
UBCBT-Y 2-18-2015

Using complex physics, I measure the internal force behind price movement that is the energy within the system. This is that FORCE of tug and pull between the bulls and the bears. This view is strikingly different from oscillators for it illustrates the degree of a market reaching its maximum entropy that reveals over-bought and over-sold.
UBOSC-Y 2-18-2015

An oscillator functions entirely differently and is a simple one-dimensional layer of math. That is still a flat model of a market, but it requires human interpretation to reveal the difference between two or more markets introducing human error.
UBVOL-Y 2-18-2015

Even mapping out volatility depends on your definition. There is internal volatility with the distance between a high and low, overnight reflecting yesterday’s close to today’s open and then there is close to close. Then people apply moving averages etc.
UBBI1-Y 2-18-2015

Utilizing applied physics enabled me to see things deeper. Bifurcation modeling managed to pick turning points with exceptional accuracy. Nonetheless, this was still just a flat model.
UBBI2-Y 2-18-2015

Bifurcation models showed the high for the 30 year bonds in 2012 and points to 2018/2019 as the next key target period. However, it is the ENERGY mode that reveals the bubble. Look closely at the first chart. You will see the difference with the sharp spike to the upside for 2012/
UBFOR-Y 2-18-2015
In our forecasting array, we have brought together 72 models. The best way to look at this for beginners is the top row composite. This is the sum of all models and the targets that are the highest and lowest reflect turning points. The colors simply change with the direction.
OldTheories
Keeping an open mind allows us to learn. A closed mind reflect the idiot who will never learn and instead will cling to his old theories until they die. The greatest of all mistakes is they always try to create some linear relationship reducing the complexity of the world to a since cause and effect. This is human nature unable to advance.