At What Point do we reach Euphoria in the Equity Markets?
Posted Jan 5, 2018 by Martin Armstrong
QUESTION:
Marty,
John Templeton has said “Bull markets are born in pessimism, grow on skepticism, mature on optimism and die on euphoria. The time of maximum pessimism is the best time to buy, and the time of maximum optimism is the best time to sell.” “If you want to have a better performance than the crowd, you must do things differently from the crowd.”
My question is…….. at what point do we reach euphoria in the equity markets?
ANSWER: Our Energy Models are designed to ascertain that dimension of a market. Naturally, everyone responds to whatever the last event is in recent memory. Therefore, the 2007-2009 Crash lives on in their experience so that means they will be skeptical of new highs. We have witnessed that with analysts constantly calling for every new high would be the last. They keep trying to forecast the last event because they missed that one as well.
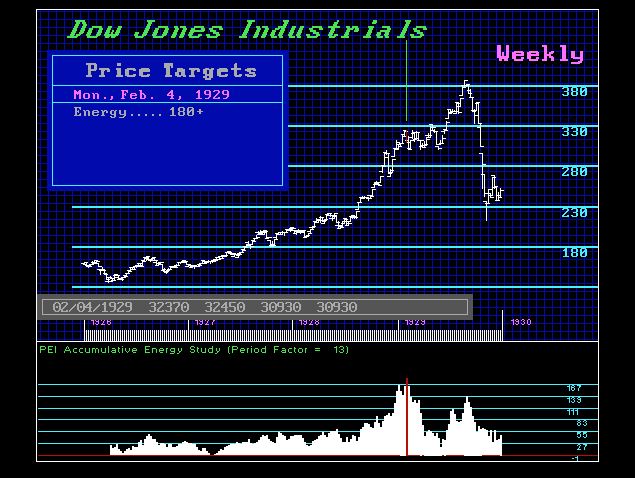
The only way to approach this is from a quantitative viewpoint. Human opinion will inevitably be wrong no matter who it is. How the market responds to our Energy Models is critical for long-term forecasting. Look at the chart for 1929. Here you see that there is a huge spike in energy which peaked in February 1929. The market rallied to new highs but note that the Energy Models we not making new highs. This peak BEFORE the major high confirmed a very serious undermining of the market structure warning that this type of high was a Bubble and therefore would not be exceeded for decades.
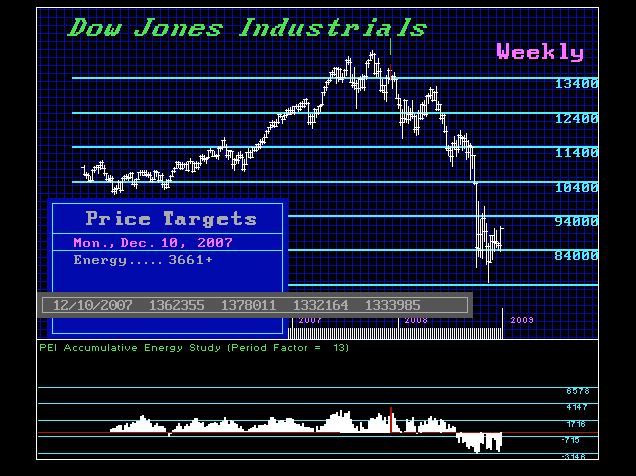
Now compare this to the Energy Models for the 2007 high. We do not have a BUBBLE formation at all and the high came on the reaction high following the major high for the move. This confirmed this was by no means a BUBBLE and in fact new record highs would be make once again.
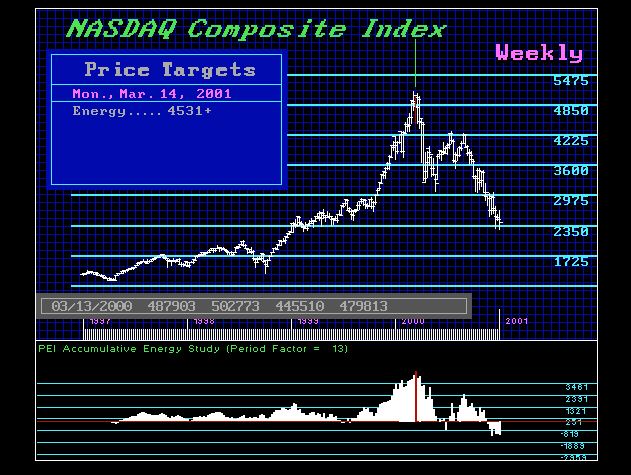
Let’s turn to the DOT.COM BUBBLE. The first thing you will notice is that the Energy was clearly in a BUBBLE formation. The slight difference here is that the Energy Model peaked the week after the high rather than before. This confirmed that it was not going to be a 1929 type event and the new record highs would be made which indeed unfolded in April 2015 which was 61 quarters intraday and 66 quarters to close above the 2000 high on a quarterly basis.
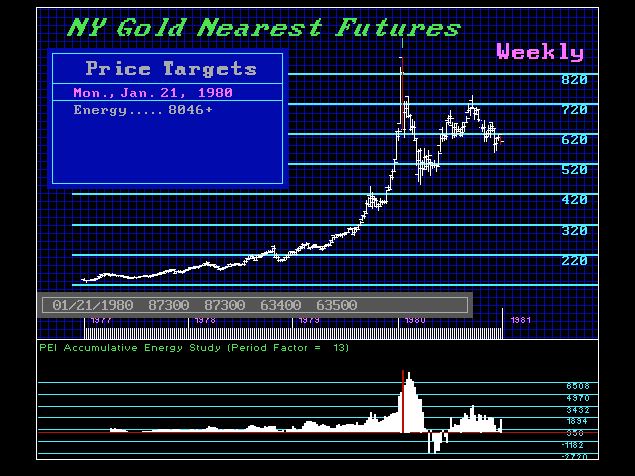
Here is gold for the 1980 BUBBLE. Once again you see the extreme BUBBLE formation and here the peak took place with the peak in gold. So while we are not looking at the same type of formation with the peak unfolding in advance of the high as in 1929, this reflected that gold would eventually make new record highs within a mid-term perspective. Unquestionable, it took 19 years for gold to decline before the major low was established. Gold finally exceeded the 1980 high during the crisis of 2008.
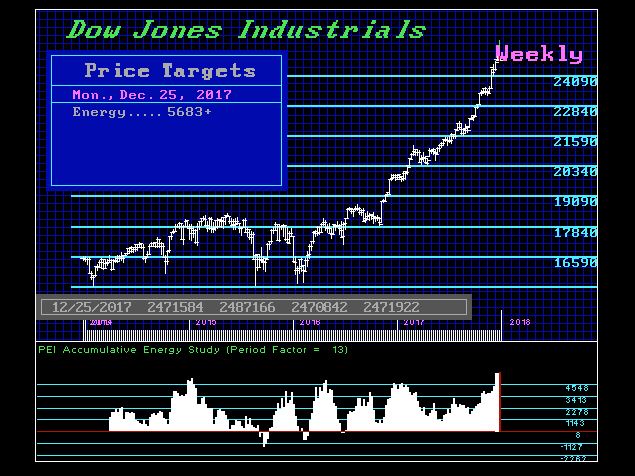
Now, let us look at the current situation. Again we do not have a major BUBBLEformation. What we do have is a market that is still expanding and in fact, the high on our Energy Models on the weekly level took place last week. This implies we would still press higher into January and that has been out target once you exceeded the November high.
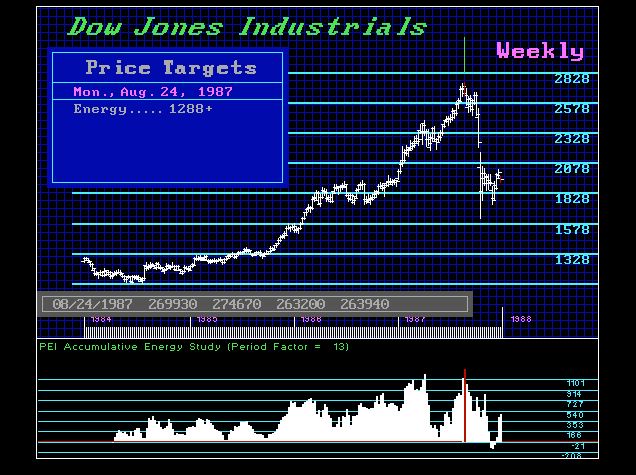
We are by no means in a 1929 BUBBLE type of formation. Here is the view of the 1987 Crash. Like Gold, the peak came 1 week following the high. Yet we see escalating advances in Energy leading into the 1987 high. So far, we lack that type of pattern warning that the real advance in our Energy Models is yet to come.
Therefore, the answer to your question is rather simple. It is always a matter of TIME rather than price. As markets rally, human interpretation of price will always be wrong.NOBODY is going to call this final high from a human perspective and anyone who claims that will be a fraud. It is not a matter of opinion for we can personally only forecast what we think is possible, to begin with.
No comments:
Post a Comment