Posted Mar 18, 2016 by Martin Armstrong
QUESTION: Marty, you have said since the S&P500 and the NASDAQ took out last year’s low and the Dow did not, it does not necessarily imply the Dow must do so since it is international compared to the others being domestic. You said that crude had to close below $35 at year end or it would bounce. That too has unfolded. You also said the euro “should” rally back to retest the 116 level before resuming a decline. You have taught us inter-connectivity and to approach a market from the yearly level on down. You have shown us turning points, and period of high volatility and your reversals are astonishing, very to the point and black and white. Do you think it takes a non-linear thinker to grasp how all this functions? Some people seem dense and no matter what you say they will always disagree. So is it the non-linear ability that makes a good trader? The difference between your caveman and a real analyst?
Cheers
PD

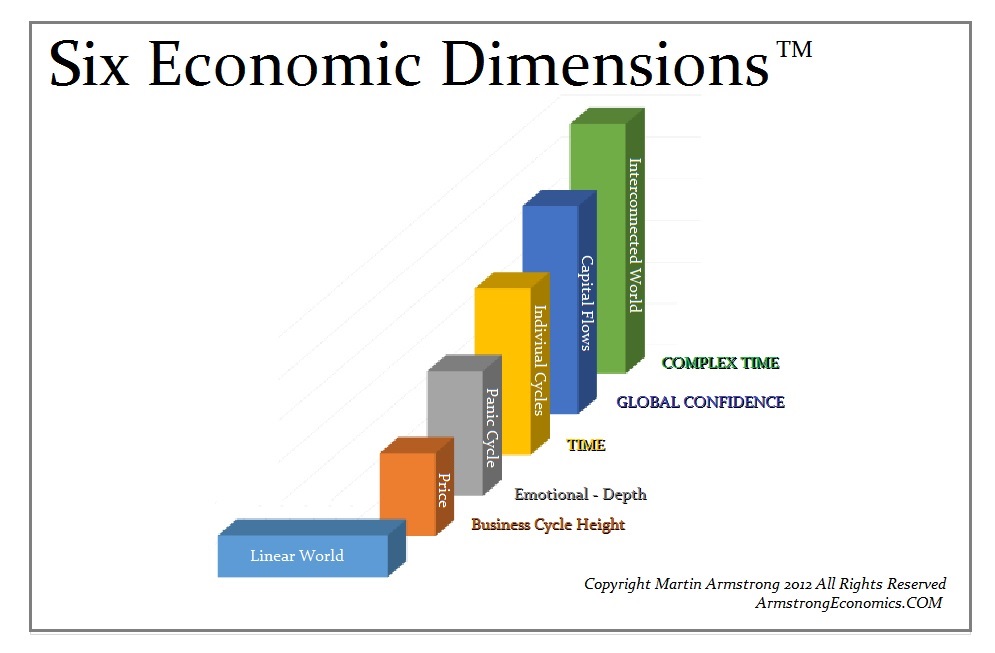
ANSWER: Perhaps. The primitive analysis is unable to see outside one dimension. I suppose there are people who can only see a straight line. That one-dimensional observation limitation typically condemns them to government employment or just followers. True, no matter what you show them, they will not be able to grasp the substance of what you are saying. So it is pointless to try to argue with such people for you cannot win. It is like a diehard Democrat or Republican. No matter what you show them, they are unable to see beyond their own bias typically repeating the brainwashing of that affiliation.
Honestly, I cannot recall how many times I have stated the markets are bothinterconnected and fractal. The Daily level is the “noise”, while the “trend” emerges only starting with the weekly level insofar as reactions. The long-term trend shifts only from the monthly level on up. You do not even get interesting until you start to elect Weekly Reversals.
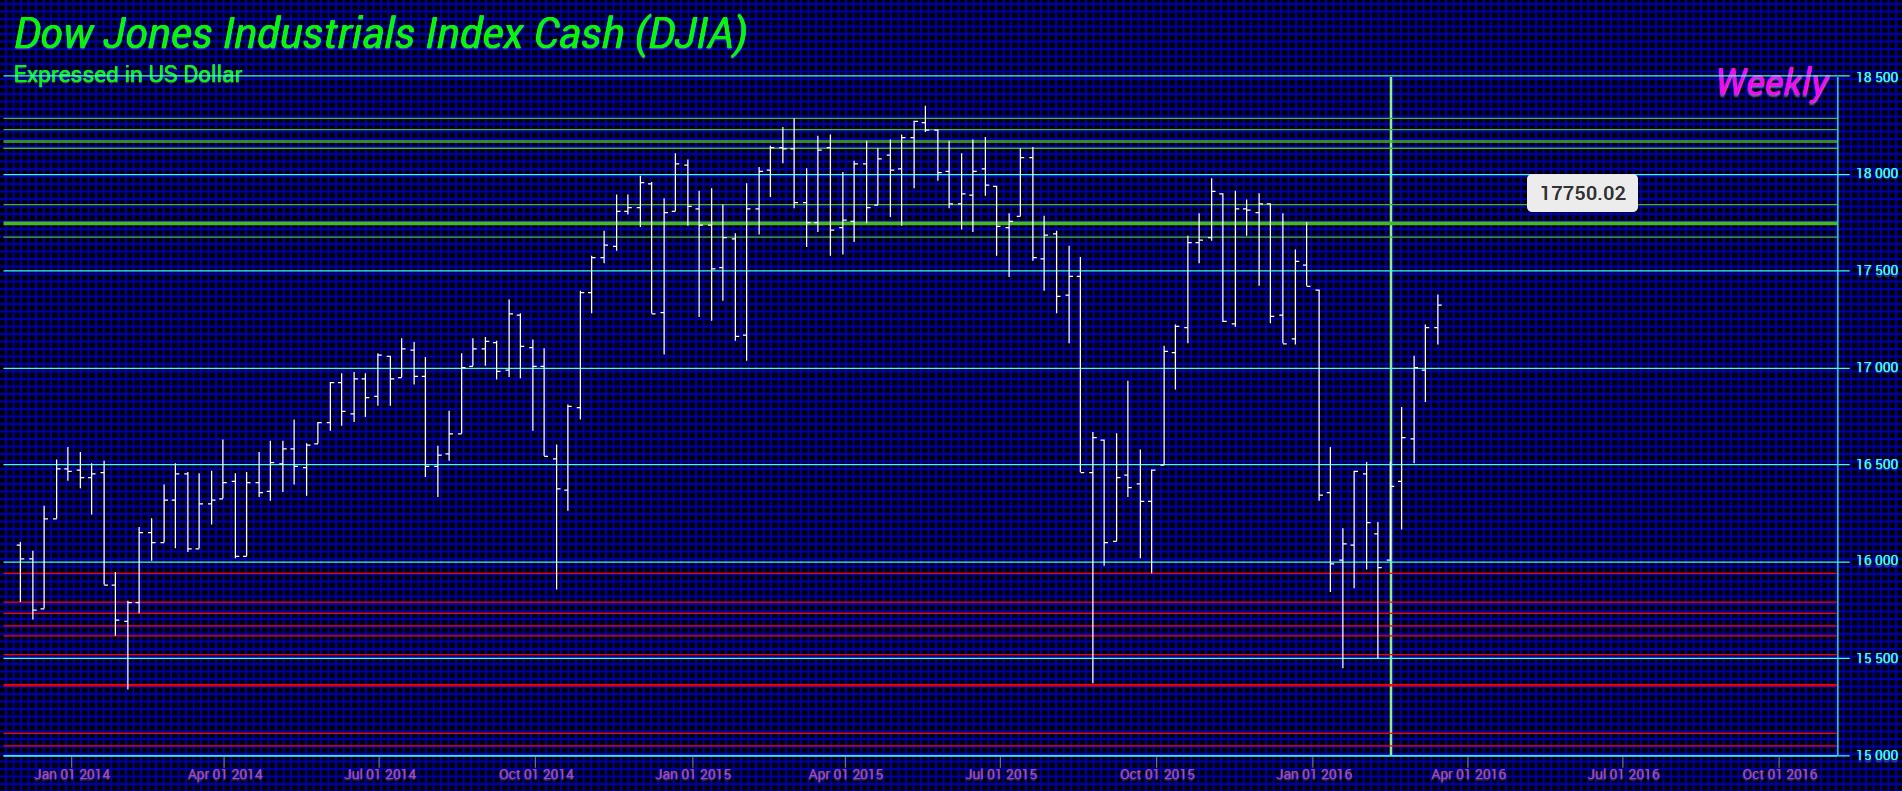
Yes, the Dow is like the trophy real estate. The Japanese once bought Rockefeller Center. The Chinese today buy the most expensive properties in US real estate whereas the Canadians are the number one buyer insofar as the quantity of properties. In stocks, this is the difference between the Dow compared to S&P500 and the NASDAQ. You can have a high-flying stock on NASDAQ and the Chinese would never buy it because nobody ever heard of the company in mainstream. So the Dow NOT penetrating last year’s low is in line with the difference between international capital flows and domestic. The very first Weekly Bullish Reversal does not come into play until the 17750 zone. This wide gap illustrates how far a market can rally WITHOUT actually change the trend in motion.

We will probably have workshops at this year’s WEC and perhaps do this over a 4 day event in total so the pros are not suffering from boredom and can attend only the professional sessions of analysis. To me the system is logical and simple, but I am a trader from my youth. Here is just the Daily Reversals without using them in reverse or merging with TIME. We are still porting this over for the Trader version and testing. Most of the verbiage has been corrected and the last 3 months of work there will be moved over to the Preview and Investor sites next week. But here you can see just using the Daily Reversals captures the “noise”. If we then turn to the Weekly level, we elected the first four Bearish from the May high we were forecasting and that signaled a serious correction confirming what the timing models forecast. The Dow fell and stopped at 15370 whereas the previous year’s low was 15340. The Weekly Bearish resided at 15362 and the technical support we reported was 15176.26. We also warned that August had to close below BELOW 15555 to spark a sharp continued decline. We are able to define the lines in the sand. Using the Reversals in the negative you would simply cover shorts at such a level and reenter if these areas are broken. They all held. The Daily Bullish were being elected within 7 days. Therefore, there was no reason to have a short position any longer. You should have covered against the previous year’s low and re-enter either penetrating 15176 intraday or a weekly close below 15362. Let the market to its thing.

Now we approach the 17750 level which is the FIRST Weekly Bullish. So you step out of any long-position and re-enter a long position if that level is exceeded on a weekly closing basis, but we still have to be careful that 18100 is exceeded or step out again (see quarterly). This week is a turning point for they are the lowest and the highest bars in the top row of the Array. We have a Panic Cycle coming into play next week and another turning point the week of 03/28 with a Directional Change the week after. So timing is warning we are starting to push the limits. The prudent thing is step out and let the market make the call. We have the time and price. Just let the market tell you. This is where using the reversals in a NEGATIVE manner comes into play.

To grasp the strategy, we start with the yearly level in this Fractal dimension. We see that 2017 is a key target. We also know that reactions are 2 to 3 time units. We also know that the strongest way markets make moves is through a slingshot. So, if we fail to get through resistance and cannot close on a weekly level above 17750, there is nothing to get excited about. We can still flip to the downside and penetrate that low going into 2017 completing a 2 year reaction and then flip to the upside into 2020.

We then turn to the quarterly level. We had a Directional Change for the first quarter of 2016 so a bullish reaction for the first quarter was nothing unusual. Here we have a Quarterly Bullish at 18106. So here we can see that is some distance to cover for the March closing when that comes into play. Assuming we did test that level in the remainder of March, we look to the What-If Models to ask what would the Quarterly Bearish be if we reached that level and failed? That returns 17575. So you can see that the bearish reversals are rising rapidly and that is also warning that we either breakout or breakdown. Since we are running out of time, it is more likely-than-not that we will head lower rather than higher.
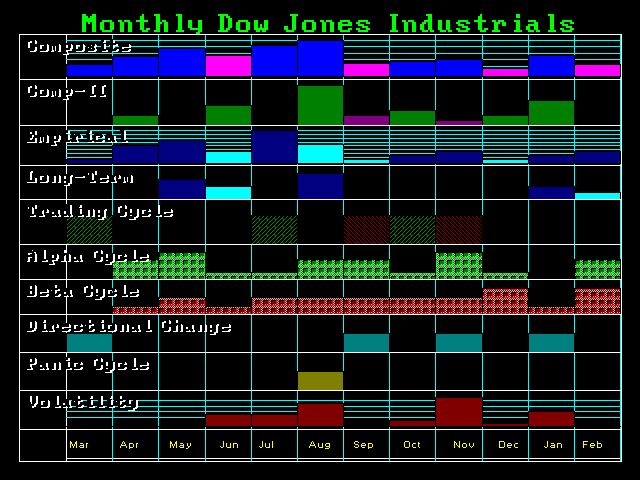
Now we turn to the monthly level in the Fractal game. Here we can see a Directional Change and turning point has been March followed by May and then we have August with a Panic Cycle. Interesting pattern of Directional Changes spread out into January. The big turning point on the Empirical (fixed) quarterly level is the 1st Quarter 2017 with some spillover into the 2nd Quarter.
 Fundamentally, this is the year from political hell. The Republicans will no doubt change the rules of the convention to try to stop Trump. They will figure this will blow-over. But they are dead wrong. To stop Trump they will expose that the American people have no real right to vote at all. It is always the “elite” who determine who is president. Europe is finding out that the Troika are not elected people – Lagarde, Draghi, and the head of the Commission. There is no means to vote these people out of power. American are about to discover they vote only for DELEGATES and not actually candidates. The rules they made to prevent Ron Paul’s name from even be introduced at the last Republican Convention are coming back to bite them in the ass. They meanONLY Trump’s name could be introduced. So they will change the rules to stop him showing they change the rules so they can do as they like. There is no rule of law here. American are about to discover they have been bullshitted to all these years. So we are looking at a collapse in CONFIDENCE that has existed in government since World War II. The game is over and this is what we must grasp lies on the horizon for 2017 – the Year from Political Hell. The markets are trying to warn us here. So pay attention.
It does get very frustrating when you constantly get criticized by people who do not understand the markets or how they move so they lash out at you. There are people who are ALWAYS going to be negative because this is personal to them and just as they treat Trump, they will bad mouth me to try to PREVENT people from learning or using the model. This is their goal. The more negative they get, they more of their agenda they expose. Such people make me ask why the hell do I care? Just retire since I do not need the grief or the money. At the very least I will bar such people from subscribing to anything. They make me feel like I should just go find that beach and just wait for the mushroom cloud to appear and it will be like having your home fumigated. Only then come out when it has been wiped cleaned. They are the worst of humanity; the real bottom feeders. They contribute nothing to society and are only in the game for themselves. So they try to prevent others from learning what they are incapable of seeing. If they cannot figure this model out, then nobody else should.
Then I realize just judge the source. Such nasty people are incapable of learning because they constantly want to blame others for their own stupidity. The solution is bar them from subscribing to any service or attending any conference. They are the very type of people who stop any advancement in society for anything they do not instantly understand must be garbage and a piece of shit. They are really the people who destroy civilization for they are the cancer that compels us to repeat history over and over again. It does not matter if they are incapable of comprehending a model or anything else in society. They will tear something down to prevent any advancement which leaves them behind. They are incapable of ever becoming a professional trader for as soon as you declare yourself all knowledgeable, you cannot learn from your experience and you are incapable of helping society ever advance. The key to trading is to be flexible and go with the flow. If you cannot do that, you cannot trade. The market speak to us. The model I designed allows us to quantify what they are saying. It is very black and white. This is notOPINION or what I think should happen. I have nothing to do with that forecast. So they can bash me all they want, it is they who are the ignorant fool incapable of every learning anything.
 Professionals do not want the nonsense. Keep it black and white. You have turning points and Reversals. You elect one, you should move to the next. The turning points tell you how long you have in time.
Here is the reversal set up for the 1987 and 1989 major highs in the S&P500. In the case of 1987, it was a Friday and we elected both the Weekly Bearish Reversals.

We have two Weekly Bearish at 286.10. We closed that week at 282.30. That was the weekend of a World Economic Conference. I stood on that stage trying to find some technical support before the next reversal at 181.00 I could find nothing.The arrays gave us a turning point in 2 days. That was the precise day of the Economic Confidence Model.
Everyone was asking me what would happen. All I could say is look. We have a gap of about 10,000 basis points and the timing is 2 days. That is what this says. Do I think it is crazy? Of course. But I said, hey, that’s what it is telling us. The the day of the low I put out an urgent report saying the objective were met and we would then make new highs.
The “gap” for the 1989 turn in the USA was nothing. The crisis would be in Tokyo. We simply dropped from the 345 level to 323.
The model shows you the TIME and PRICE. You simply have to look at this layer by layer. I warned gold was NOT as weak as it appeared because it held the 1045 level for the year-end closing. Crude held the $35. These things do not happen randomly. The market speak to us if you are not so bull-head to listen and learn for once instead of being always negative. The negative people will get what they deserve – total wipe out.
No comments:
Post a Comment