Slingshot v Phase Transition
Posted Aug 7, 2016 by Martin Armstrong
You’ve just mentioned there remains a chance for gold to perform a slingshot move downward and then up in January. Does it still appear the Dow will slingshot (make a new low) also even though it has recently broken to new highs?
S
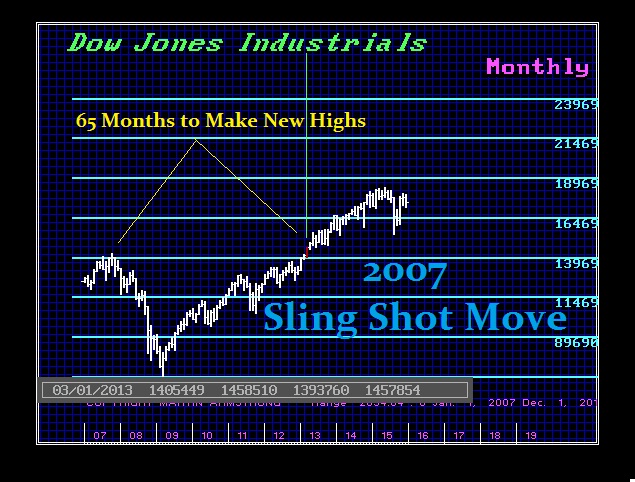
ANSWER: We achieved the SLINGSHOT in the S&P and the NADAQ and I have previously warned that we did not need to do that in the DOW. Still, there are SLINGSHOT type of moves that are fractal, so they take place on a daily, weekly, and monthly level. We do not need to accomplish that in the stock market. However, since this is 2016 which is 7 years up from the low, there runs the risk of a temporary high and what might appear to be a correction in 2017. However, this need not be a SLINGSHOT insofar an penetrating the 2016 low. The majority are bearish already. Therefore, we can coil and build a based for a PHASE TRANSITION. However, keep in mind we are running out of time. This in itself is rather serious because we may have no time before the explosion unfolds and these four political elections from HELL are illustrating there is a problem with confidence in government.
The difference between a SLINGSHOT and a PHASE TRANSITION is rather significant.
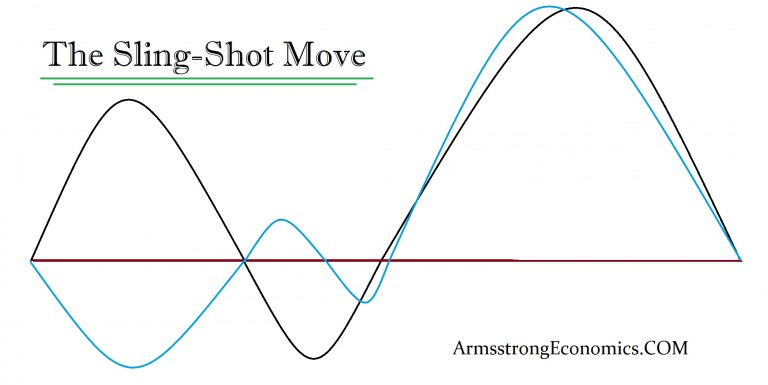
The SLINGSHOT typically fakes everyone out by moving first in the FALSE direction and then it swings back a moves to new record highs or lows. The fuel to create such a move is trapping people on the wrong side and then they fight it. For example, when everyone just sits with positions and praying for new highs, they lack the buying power to keep the trend moving and everyone wants to sell the new high to make a profit or break-even. That typically results in just a water-torture test of slowing eating away at those long positions.

This type of pattern where bulls refuse to admit a mistake causes a 19 year Bear Market which is classic. This was the primary reason why the NIKKEI could not recover in Japan. Everyone was long just waiting for the rally so they could sell just to break even. Real Estate agents I know in New Jersey say if the price of the average home ever got back close to 2007 levels, half the State would be up for sale. This is simply how ALL markets trade be it gold, stocks of real estate. This appears on a worldwide basis regardless of culture or the century. This is simply how human nature responds. People will cling to their mistakes for a very long-time before they throw in the towel.
 So yes. Unless gold can close above 1362 on a monthly basis, the risk of a SLINGSHOT move still exists. Of course the gold bugs will say never. They are no different than the Japanese who refused to believe the NIKKEI would make lower lows. But this is the actual mechanism that create the breakout rallies. The greater the SLINGSHOT on the downside, the steeper the move on the upside.
This is simple physics. The more you pull back on the projectile, the further it will travel. Why has the US share market continued to rally yet the VAST MAJORITY keep calling for a crash? This is precisely how a SLINGSHOT operates. The fuel to the upside is created by that false move which can last for several years. They are still fighting the market and keep trying to sell the high. They are constantly forced to buy it back.
The most bullish position for gold would not be a rally, but a SLINGSHOT to the downside FIRST. That will convince everyone it’s a bear market and then they will fight the rally exactly as they have done in the US share market. Then you will have the confirmation that it will move higher.
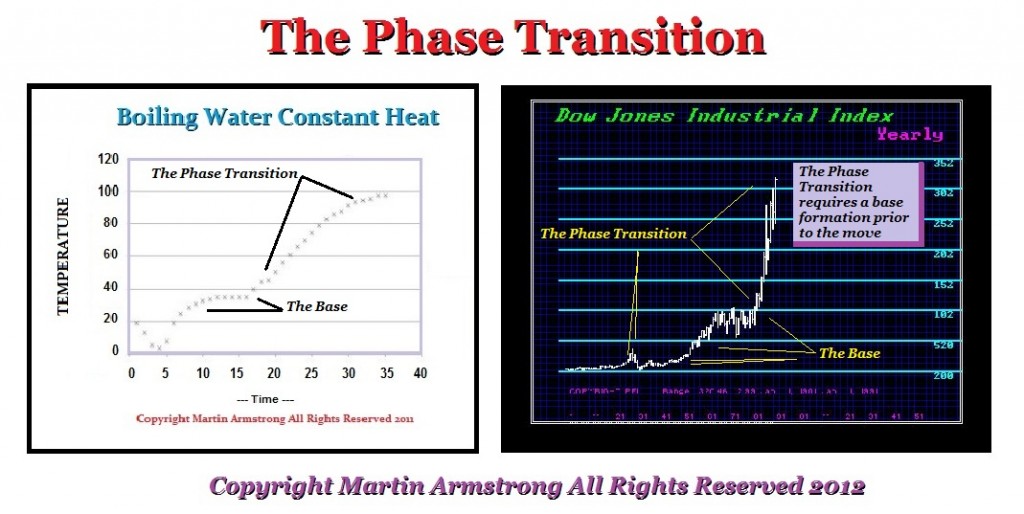
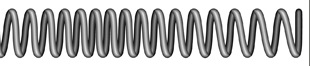
A Phase Transition is different. This is an explosive rally which emerges from a base which is akin to a spring. The tighter the spring is compressed, the greater the move to a new level. This is something that is mathematically calculated with the degree of energy that has been compressed. When released, it simply explodes. This is often the type of move which sucks everyone in and they then expect this to be the norm.
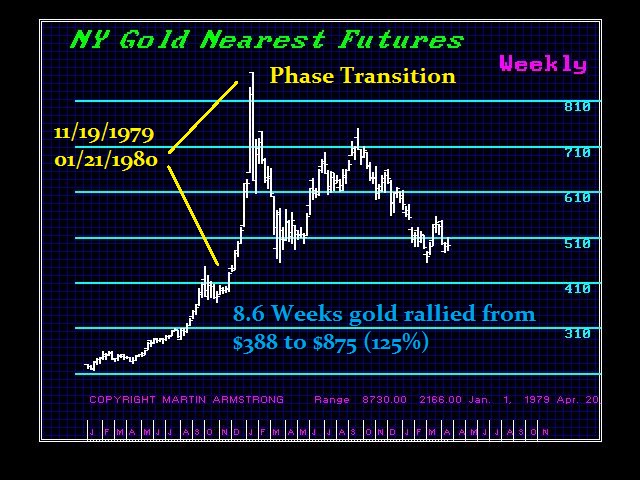
 Phase Transitions often alter the thinking of people so dramatically that they lose all reason. The Phase Transition in gold creating the 1980 high on January 21st, 1980 at $875, unfolded in just 8.6 weeks. That simple brief period set in motion decades of people calling for the same thing over and over again. That brief Phase Transition convinced scores of people this was permanent and gold would now soar to multiple of $1,000.
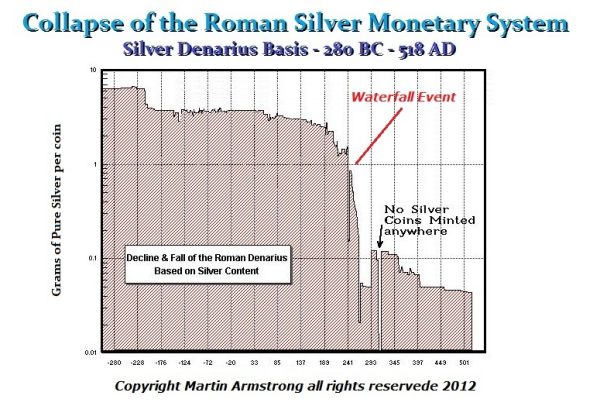
The collapse of Rome was also just 8.6 years. It is amazing how this frequency appears throughout history and has such a profound change to the upside or downside. We see the complete implosion of the Roman economy where the coinage was mostly silver to less than 2%. People hoarded money so to pay the bills, the only recourse was debasement. Taxes collapsed as did the economy just after the Emperor Valerian I was captured in 260AD. By 268AD, his son Gallienus is assassinated and the coinage no longer resembles what existed pre-260AD.


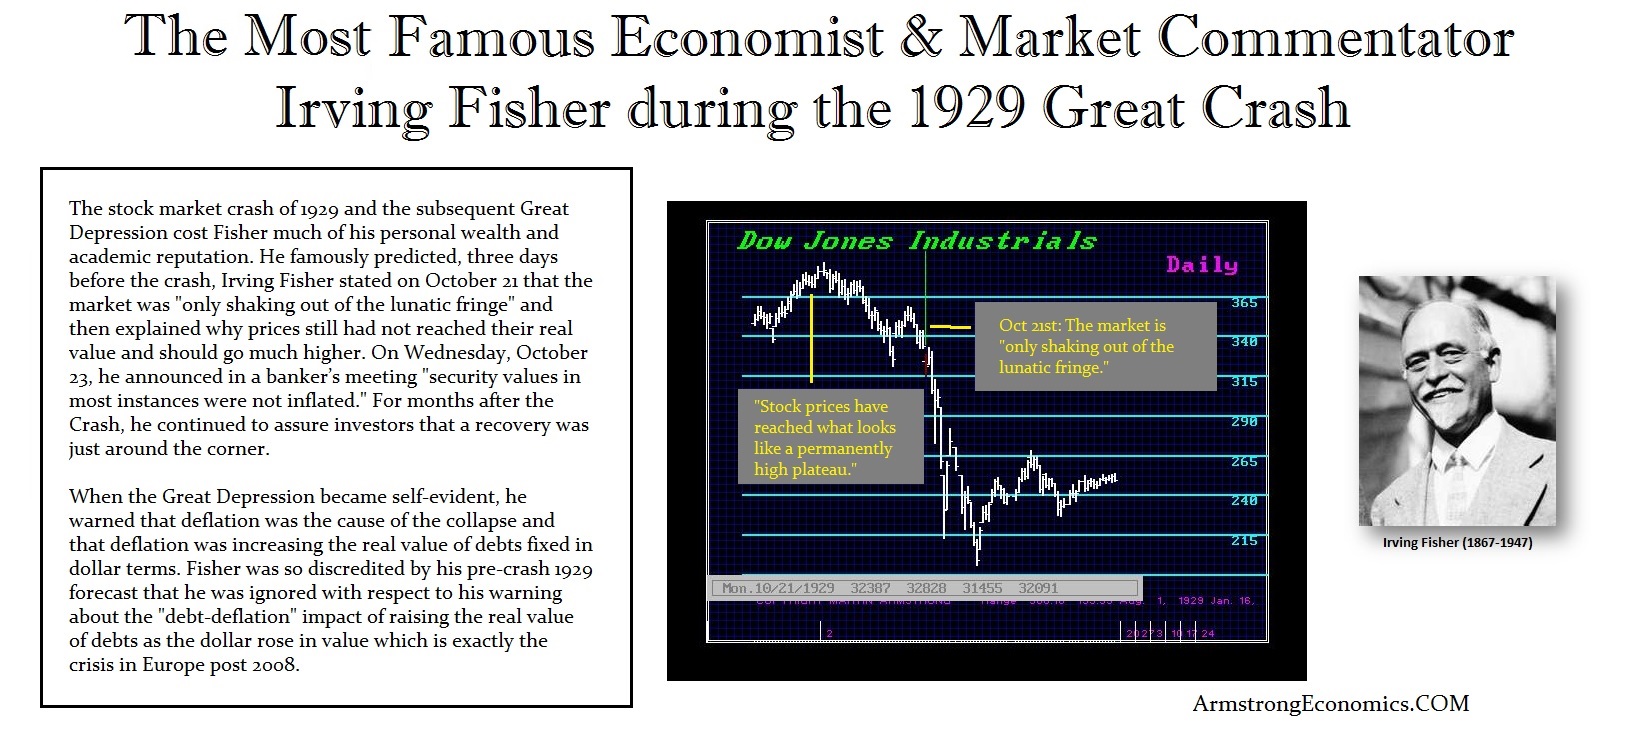
The Phase Transition in the Dow going into 1929 ruined the reputation of the leading economist and market commentator Irving Fisher (1867-1947). Three days before the high he pronounced that the “stock prices have reached what looks like a permanently high plateau.” The Phase Transition of the US share Market into 1929 on a monthly level was 37.3 months (8.615 * 4.3). Likewise, on the weekly level, the overall final Phase Transition was also 13 weeks from 300.10 to 386.10. However, on the daily level, the final rally was a brief SLINGSHOT and from that low it was a 17.2 day rally (2 * 8.6). Therefore, it was within that final 17.2 days that caused Fisher to proclaim a new permanent high level. This is the classic Phase Transition. Then, even as the market began to crash, precisely on the 34th day of that decline a temporary low formed which was 4 cycles of 8.6 days. He then pronounced that the market was “only shaking out of the lunatic fringe.” He coined a saying that has long since remained.
Thereafter, Fisher came to understand the mechanism that a rising currency increased the “real value” of debt and people could not then service that debt resulting in a cascade of defaults. Nevertheless, the Phase Transition has a historical impact upon the thinking process of people. In Japan, it took 19 years to reverse that decline as it did in gold. In the case of the US stock market, it took 25 years to exceed that 1929 high. It was 19 years until 1948 which was the final fake low before the breakout rally truly began which was also 19 years. In the case of Europe, it appears it may also take until 2027 before any real life comes back into the economy once again
Posted Aug 7, 2016 by Martin Armstrong
You’ve just mentioned there remains a chance for gold to perform a slingshot move downward and then up in January. Does it still appear the Dow will slingshot (make a new low) also even though it has recently broken to new highs?
S
ANSWER: We achieved the SLINGSHOT in the S&P and the NADAQ and I have previously warned that we did not need to do that in the DOW. Still, there are SLINGSHOT type of moves that are fractal, so they take place on a daily, weekly, and monthly level. We do not need to accomplish that in the stock market. However, since this is 2016 which is 7 years up from the low, there runs the risk of a temporary high and what might appear to be a correction in 2017. However, this need not be a SLINGSHOT insofar an penetrating the 2016 low. The majority are bearish already. Therefore, we can coil and build a based for a PHASE TRANSITION. However, keep in mind we are running out of time. This in itself is rather serious because we may have no time before the explosion unfolds and these four political elections from HELL are illustrating there is a problem with confidence in government.
The difference between a SLINGSHOT and a PHASE TRANSITION is rather significant.
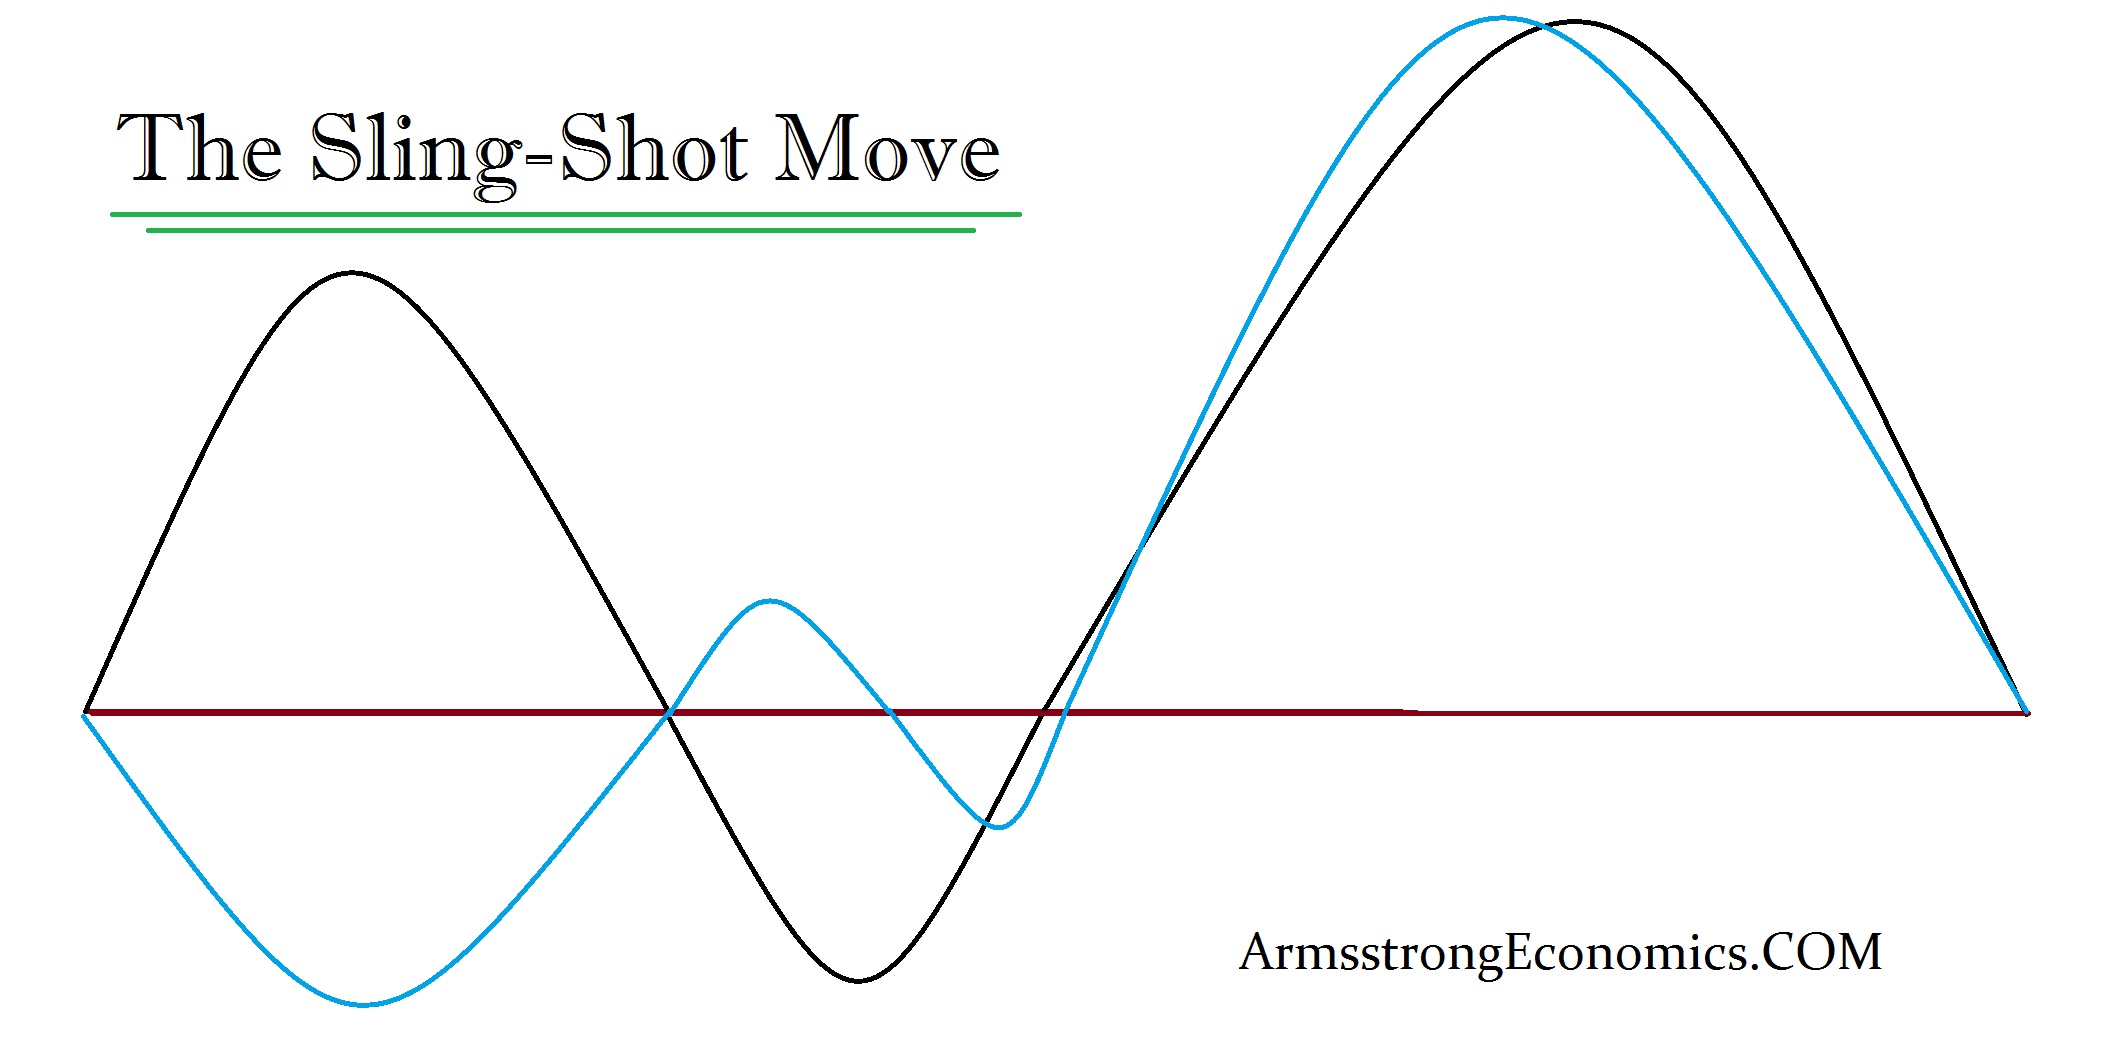
The SLINGSHOT typically fakes everyone out by moving first in the FALSE direction and then it swings back a moves to new record highs or lows. The fuel to create such a move is trapping people on the wrong side and then they fight it. For example, when everyone just sits with positions and praying for new highs, they lack the buying power to keep the trend moving and everyone wants to sell the new high to make a profit or break-even. That typically results in just a water-torture test of slowing eating away at those long positions.
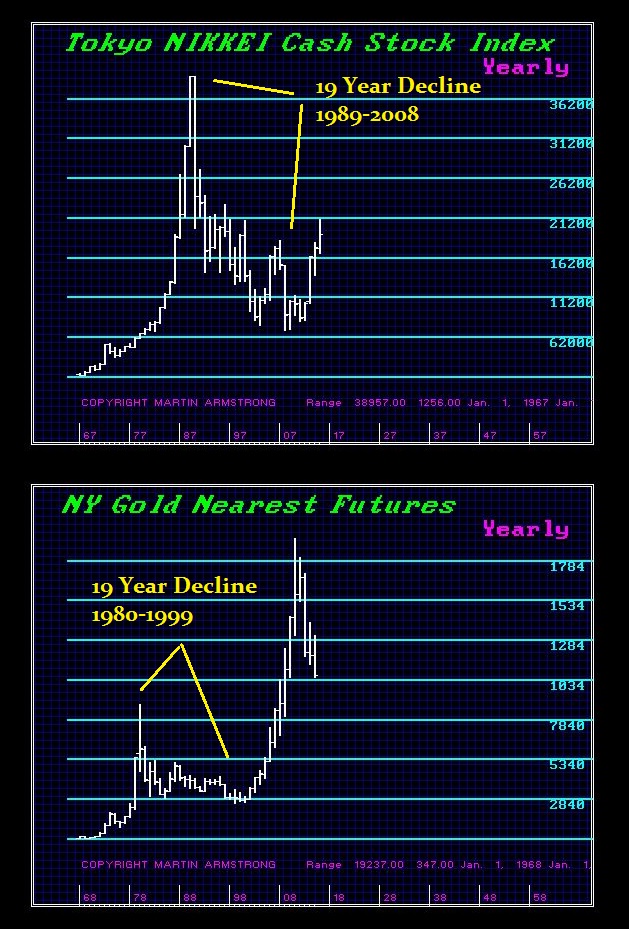
This type of pattern where bulls refuse to admit a mistake causes a 19 year Bear Market which is classic. This was the primary reason why the NIKKEI could not recover in Japan. Everyone was long just waiting for the rally so they could sell just to break even. Real Estate agents I know in New Jersey say if the price of the average home ever got back close to 2007 levels, half the State would be up for sale. This is simply how ALL markets trade be it gold, stocks of real estate. This appears on a worldwide basis regardless of culture or the century. This is simply how human nature responds. People will cling to their mistakes for a very long-time before they throw in the towel.

 So yes. Unless gold can close above 1362 on a monthly basis, the risk of a SLINGSHOT move still exists. Of course the gold bugs will say never. They are no different than the Japanese who refused to believe the NIKKEI would make lower lows. But this is the actual mechanism that create the breakout rallies. The greater the SLINGSHOT on the downside, the steeper the move on the upside.
This is simple physics. The more you pull back on the projectile, the further it will travel. Why has the US share market continued to rally yet the VAST MAJORITY keep calling for a crash? This is precisely how a SLINGSHOT operates. The fuel to the upside is created by that false move which can last for several years. They are still fighting the market and keep trying to sell the high. They are constantly forced to buy it back.
The most bullish position for gold would not be a rally, but a SLINGSHOT to the downside FIRST. That will convince everyone it’s a bear market and then they will fight the rally exactly as they have done in the US share market. Then you will have the confirmation that it will move higher.

A Phase Transition is different. This is an explosive rally which emerges from a base which is akin to a spring. The tighter the spring is compressed, the greater the move to a new level. This is something that is mathematically calculated with the degree of energy that has been compressed. When released, it simply explodes. This is often the type of move which sucks everyone in and they then expect this to be the norm.

 Phase Transitions often alter the thinking of people so dramatically that they lose all reason. The Phase Transition in gold creating the 1980 high on January 21st, 1980 at $875, unfolded in just 8.6 weeks. That simple brief period set in motion decades of people calling for the same thing over and over again. That brief Phase Transition convinced scores of people this was permanent and gold would now soar to multiple of $1,000.
The collapse of Rome was also just 8.6 years. It is amazing how this frequency appears throughout history and has such a profound change to the upside or downside. We see the complete implosion of the Roman economy where the coinage was mostly silver to less than 2%. People hoarded money so to pay the bills, the only recourse was debasement. Taxes collapsed as did the economy just after the Emperor Valerian I was captured in 260AD. By 268AD, his son Gallienus is assassinated and the coinage no longer resembles what existed pre-260AD.

The Phase Transition in the Dow going into 1929 ruined the reputation of the leading economist and market commentator Irving Fisher (1867-1947). Three days before the high he pronounced that the “stock prices have reached what looks like a permanently high plateau.” The Phase Transition of the US share Market into 1929 on a monthly level was 37.3 months (8.615 * 4.3). Likewise, on the weekly level, the overall final Phase Transition was also 13 weeks from 300.10 to 386.10. However, on the daily level, the final rally was a brief SLINGSHOT and from that low it was a 17.2 day rally (2 * 8.6). Therefore, it was within that final 17.2 days that caused Fisher to proclaim a new permanent high level. This is the classic Phase Transition. Then, even as the market began to crash, precisely on the 34th day of that decline a temporary low formed which was 4 cycles of 8.6 days. He then pronounced that the market was “only shaking out of the lunatic fringe.” He coined a saying that has long since remained.
Thereafter, Fisher came to understand the mechanism that a rising currency increased the “real value” of debt and people could not then service that debt resulting in a cascade of defaults. Nevertheless, the Phase Transition has a historical impact upon the thinking process of people. In Japan, it took 19 years to reverse that decline as it did in gold. In the case of the US stock market, it took 25 years to exceed that 1929 high. It was 19 years until 1948 which was the final fake low before the breakout rally truly began which was also 19 years. In the case of Europe, it appears it may also take until 2027 before any real life comes back into the economy once again
No comments:
Post a Comment